How to Add Centralised Logging with Loki and Promtail
Monitoring tells you when something is wrong, but it rarely tells you why. Metrics such as CPU usage, memory consumption, and container health help you identify that a problem exists, but investigating the root cause requires access to application and container logs.
In the previous article, we built a monitoring stack for Docmost using Prometheus, Grafana, Node Exporter, and cAdvisor. While that setup provides complete visibility into your server and container metrics, troubleshooting production issues still requires collecting logs from multiple Docker containers.
In this article, you'll extend the existing monitoring stack by adding centralised logging with Loki and Promtail. Promtail collects logs from every Docker container running on the server and forwards them to Loki, where they are indexed and stored. Grafana then allows you to search, filter, and analyse logs from a single interface alongside your existing metrics.
This article was tested on a live server before publication. Every command, configuration file, and verification step was validated on the final deployment to maintain accuracy.
Prerequisites
Before you begin, ensure you have the following:
-
A Linux server with Docmost already deployed using Docker Compose.
-
An external PostgreSQL database configured for your Docmost instance.
-
Docker and Docker Compose installed.
-
Prometheus, Grafana, Node Exporter, and cAdvisor already configured for monitoring.
-
A domain name pointing to your server with the following DNS records configured:
-
docmost.example.com -
grafana.docmost.example.com -
prometheus.docmost.example.com
-
Infrastructure Used
This guide was validated using the following infrastructure:
- Cloud Provider: DigitalOcean
- Operating System: Ubuntu 24.04 LTS
- Deployment Environment: Virtual Machine (Droplet)
This guide contains affiliate links. If you sign up through these links, I may earn a commission at no additional cost to you. I only recommend products and services that I personally use while testing my guides.
Create a Non-Root Administrative User
Many cloud providers provide root access by default. While this is convenient for initial setup, production deployments are generally managed through a non-root user with sudo privileges. This follows Linux security best practices and reduces the risk of accidental system-wide changes.
-
Create a new user:
adduser USERNAMEReplace:
USERNAMEwith your preferred username.
-
Grant the user sudo privileges:
usermod -aG sudo USERNAMEReplace:
USERNAMEwith the username you created in the previous step.
-
Verify that the user has sudo access:
groups USERNAMEReplace:
USERNAMEwith the username you created in the previous step.
You should see output similar to:
USERNAME : USERNAME sudo -
Switch to the new user:
su - USERNAMEReplace:
USERNAMEwith the username you created in the previous step.
-
Verify sudo access:
sudo whoamiYou should see output similar to:
root -
Allow the user to manage Docker without using the root account:
sudo usermod -aG docker USERNAMEReplace:
USERNAMEwith the username you created in the previous step.
-
Apply the new Docker group to the current session:
newgrp docker
Step 1: Create the Loki and Promtail Configuration Files
Loki requires a configuration file to define how logs are stored, indexed, and retained, while Promtail uses a configuration file to discover Docker container logs and forward them to Loki. In this step, you'll create the required directory structure and configure both services.
-
Create the project directory and navigate to it:
mkdir ~/docmost-monitoringcd ~/docmost-monitoringThis directory will contain all files related to the deployment, including the Docker Compose manifest, Prometheus configuration, and environment variables.
-
Create the directories for Loki, Promtail and Prometheus:
mkdir lokimkdir promtailmkdir prometheus -
Create the Loki configuration file:
nano loki/loki-config.ymlAdd the following configuration:
auth_enabled: falseserver:http_listen_port: 3100common:path_prefix: /lokistorage:filesystem:chunks_directory: /loki/chunksrules_directory: /loki/rulesreplication_factor: 1ring:kvstore:store: inmemoryschema_config:configs:- from: 2025-01-01store: tsdbobject_store: filesystemschema: v13index:prefix: index_period: 24hstorage_config:filesystem:directory: /loki/chunkslimits_config:retention_period: 72hreject_old_samples: truereject_old_samples_max_age: 168hcompactor:working_directory: /loki/retentionretention_enabled: truedelete_request_store: filesystemcompaction_interval: 10manalytics:reporting_enabled: falseThis configuration stores logs on the local filesystem, retains logs for 72 hours, automatically removes expired log data, and disables anonymous usage reporting.
-
Create the Promtail configuration file:
nano promtail/promtail-config.ymlAdd the following configuration:
server:http_listen_port: 9080grpc_listen_port: 0log_level: infopositions:filename: /var/lib/promtail/positions.yamlclients:- url: http://loki:3100/loki/api/v1/pushexternal_labels:host: docmost-serverscrape_configs:- job_name: dockerstatic_configs:- targets:- localhostlabels:job: docker__path__: /var/lib/docker/containers/*/*-json.logThis configuration instructs Promtail to monitor the Docker JSON log files, keep track of the last processed log position, and forward all collected logs to the Loki service running on the same Docker network.
-
Create the Prometheus configuration file.
nano prometheus/prometheus.ymlAdd the following configuration:
global:scrape_interval: 15sscrape_configs:- job_name: prometheusstatic_configs:- targets:- localhost:9090- job_name: node-exporterstatic_configs:- targets:- node-exporter:9100- job_name: cadvisorstatic_configs:- targets:- cadvisor:8080This configuration instructs Prometheus to collect metrics from itself, Node Exporter, and cAdvisor every 15 seconds.
-
Generate a secure secret:
openssl rand -hex 32Copy the generated output and paste it into the
APP_SECRETvariable in the next step. -
Create the environment file:
nano .envAdd the following configuration:
# Website ConfigurationDOMAIN_NAME=doc.example.comAPP_URL=https://doc.example.comLETSENCRYPT_EMAIL=your_email@example.com# Global Application SecretAPP_SECRET=YOUR_GENERATED_SECRET# PostgreSQL ConfigurationDATABASE_URL=DATABASE_CONNECTION_STRING# Redis ConfigurationREDIS_URL=redis://redis:6379# Grafana ConfigurationGRAFANA_ADMIN_USER=adminGRAFANA_ADMIN_PASSWORD=YOUR_GRAFANA_PASSWORDReplace the following values:
-
doc.example.comwith your domain name. -
your_email@example.comwith your email address used for SSL certificate notifications. -
DATABASE_CONNECTION_STRINGwith your PostgreSQL connection string. -
YOUR_GENERATED_SECRETwith the secret generated in the previous step. -
YOUR_GRAFANA_PASSWORDwith a strong password for the Grafana administrator account.
-
Step 2: Create the Docker Compose File
The deployment consists of nine containers. Traefik handles HTTPS traffic and SSL certificate management. Docmost runs the application, Redis provides caching and background job processing, Prometheus collects metrics, Grafana visualises the metrics, Node Exporter exposes host metrics, and cAdvisor exposes Docker container metrics.
-
Create the Docker Compose file:
nano docker-compose.yml -
Add the following configuration:
services:traefik:image: traefik:v3.6command:- "--providers.docker=true"- "--providers.docker.exposedbydefault=false"- "--providers.docker.network=monitoring"- "--entrypoints.web.address=:80"- "--entrypoints.websecure.address=:443"- "--entrypoints.web.http.redirections.entryPoint.to=websecure"- "--certificatesresolvers.letsencrypt.acme.httpchallenge=true"- "--certificatesresolvers.letsencrypt.acme.httpchallenge.entrypoint=web"- "--certificatesresolvers.letsencrypt.acme.email=${LETSENCRYPT_EMAIL}"- "--certificatesresolvers.letsencrypt.acme.storage=/letsencrypt/acme.json"ports:- "80:80"- "443:443"volumes:- /var/run/docker.sock:/var/run/docker.sock:ro- letsencrypt:/letsencryptsecurity_opt:- no-new-privileges:truerestart: unless-stoppednetworks:- monitoringdocmost:image: docmost/docmost:latestdepends_on:- redisenvironment:APP_URL: ${APP_URL}APP_SECRET: ${APP_SECRET}DATABASE_URL: ${DATABASE_URL}REDIS_URL: ${REDIS_URL}volumes:- docmost:/app/data/storagelabels:- "traefik.enable=true"- "traefik.http.routers.docmost.rule=Host(`${DOMAIN_NAME}`)"- "traefik.http.routers.docmost.entrypoints=websecure"- "traefik.http.routers.docmost.tls.certresolver=letsencrypt"- "traefik.http.services.docmost.loadbalancer.server.port=3000"security_opt:- no-new-privileges:truerestart: unless-stoppednetworks:- monitoringredis:image: redis:8command:- redis-server- --appendonly- "yes"- --maxmemory-policy- noevictionvolumes:- redis_data:/datasecurity_opt:- no-new-privileges:truerestart: unless-stoppednetworks:- monitoringnode-exporter:image: prom/node-exporter:v1.11.1command:- "--path.rootfs=/host"volumes:- "/:/host:ro,rslave"pid: hostrestart: unless-stoppednetworks:- monitoringcadvisor:image: gcr.io/cadvisor/cadvisor:v0.52.1privileged: truedevices:- /dev/kmsgvolumes:- "/:/rootfs:ro"- "/var/run:/var/run:ro"- "/sys:/sys:ro"- "/var/lib/docker:/var/lib/docker:ro"- "/dev/disk:/dev/disk:ro"restart: unless-stoppednetworks:- monitoringprometheus:image: prom/prometheus:v3.5.0command:- "--config.file=/etc/prometheus/prometheus.yml"- "--storage.tsdb.path=/prometheus"volumes:- ./prometheus/prometheus.yml:/etc/prometheus/prometheus.yml:ro- prometheus_data:/prometheuslabels:- "traefik.enable=true"- "traefik.http.routers.prometheus.rule=Host(`prometheus.${DOMAIN_NAME}`)"- "traefik.http.routers.prometheus.entrypoints=websecure"- "traefik.http.routers.prometheus.tls.certresolver=letsencrypt"- "traefik.http.services.prometheus.loadbalancer.server.port=9090"security_opt:- no-new-privileges:truerestart: unless-stoppednetworks:- monitoringloki:image: grafana/loki:3.5.3command:- "-config.file=/etc/loki/loki-config.yml"volumes:- ./loki/loki-config.yml:/etc/loki/loki-config.yml:ro- loki_data:/lokisecurity_opt:- no-new-privileges:truerestart: unless-stoppedhealthcheck:test: ["CMD", "wget", "--spider", "-q", "http://localhost:3100/ready"]interval: 30stimeout: 5sretries: 3start_period: 10snetworks:- monitoringpromtail:image: grafana/promtail:3.5.3command:- "-config.file=/etc/promtail/promtail-config.yml"depends_on:- lokivolumes:- ./promtail/promtail-config.yml:/etc/promtail/promtail-config.yml:ro- /var/lib/docker/containers:/var/lib/docker/containers:ro- promtail_positions:/var/lib/promtailsecurity_opt:- no-new-privileges:truerestart: unless-stoppedhealthcheck:test: ["CMD", "wget", "--spider", "-q", "http://localhost:9080/ready"]interval: 30stimeout: 5sretries: 3start_period: 10snetworks:- monitoringgrafana:image: grafana/grafana:12.0.2depends_on:- prometheus- lokienvironment:GF_SECURITY_ADMIN_USER: ${GRAFANA_ADMIN_USER}GF_SECURITY_ADMIN_PASSWORD: ${GRAFANA_ADMIN_PASSWORD}volumes:- grafana_data:/var/lib/grafanalabels:- "traefik.enable=true"- "traefik.http.routers.grafana.rule=Host(`grafana.${DOMAIN_NAME}`)"- "traefik.http.routers.grafana.entrypoints=websecure"- "traefik.http.routers.grafana.tls.certresolver=letsencrypt"- "traefik.http.services.grafana.loadbalancer.server.port=3000"security_opt:- no-new-privileges:truerestart: unless-stoppednetworks:- monitoringvolumes:docmost:redis_data:letsencrypt:prometheus_data:grafana_data:loki_data:promtail_positions:networks:monitoring:driver: bridge
Step 3: Deploy the Application
Docker Compose will pull the required images, create the Docker network and persistent volumes, and start all services required for the monitoring stack.
-
Start the deployment:
docker compose up -dThe first deployment may take a few minutes while Docker downloads the required container images.
-
Verify that all containers are running:
docker compose psYou should see the
traefik,docmost,redis,node-exporter,cadvisor,prometheus, andgrafanacontainers in anUpstate. -
Review the application logs:
docker compose logsTo view the logs for a specific service, use:
docker compose logs <service-name>You can replace
prometheuswithdocmost,grafana,traefik,node-exporter,cadvisor, orredisto review the logs for that service.
Step 4: Deployment Verification
Once all containers are running, you'll verify that Docmost, Prometheus, and Grafana are accessible over HTTPS.
-
Verify Docmost: Open your browser and navigate to your configured domain:
https://doc.example.comReplace:
doc.example.comwith your actual domain name.
-
Verify Prometheus: Open your browser and navigate to your Prometheus subdomain:
https://prometheus.doc.example.comReplace:
doc.example.comwith your actual domain name.
-
Verify Grafana: Open your browser and navigate to your Grafana subdomain:
https://grafana.doc.example.comReplace:
doc.example.comwith your actual domain name.
Log in using the Grafana administrator credentials you configured in the
.envfile. After logging in, confirm that you can reach the Grafana home dashboard before continuing to the next step.
Step 5: Import Grafana Dashboards
Before you import the dashboards, you must add Prometheus and Loki as data sources in Grafana.
-
Configure the Prometheus Data Source

Log in to Grafana and go to Connections → Data sources. Click Add new data source and choose Prometheus. Set the Prometheus server URL to:
http://prometheus:9090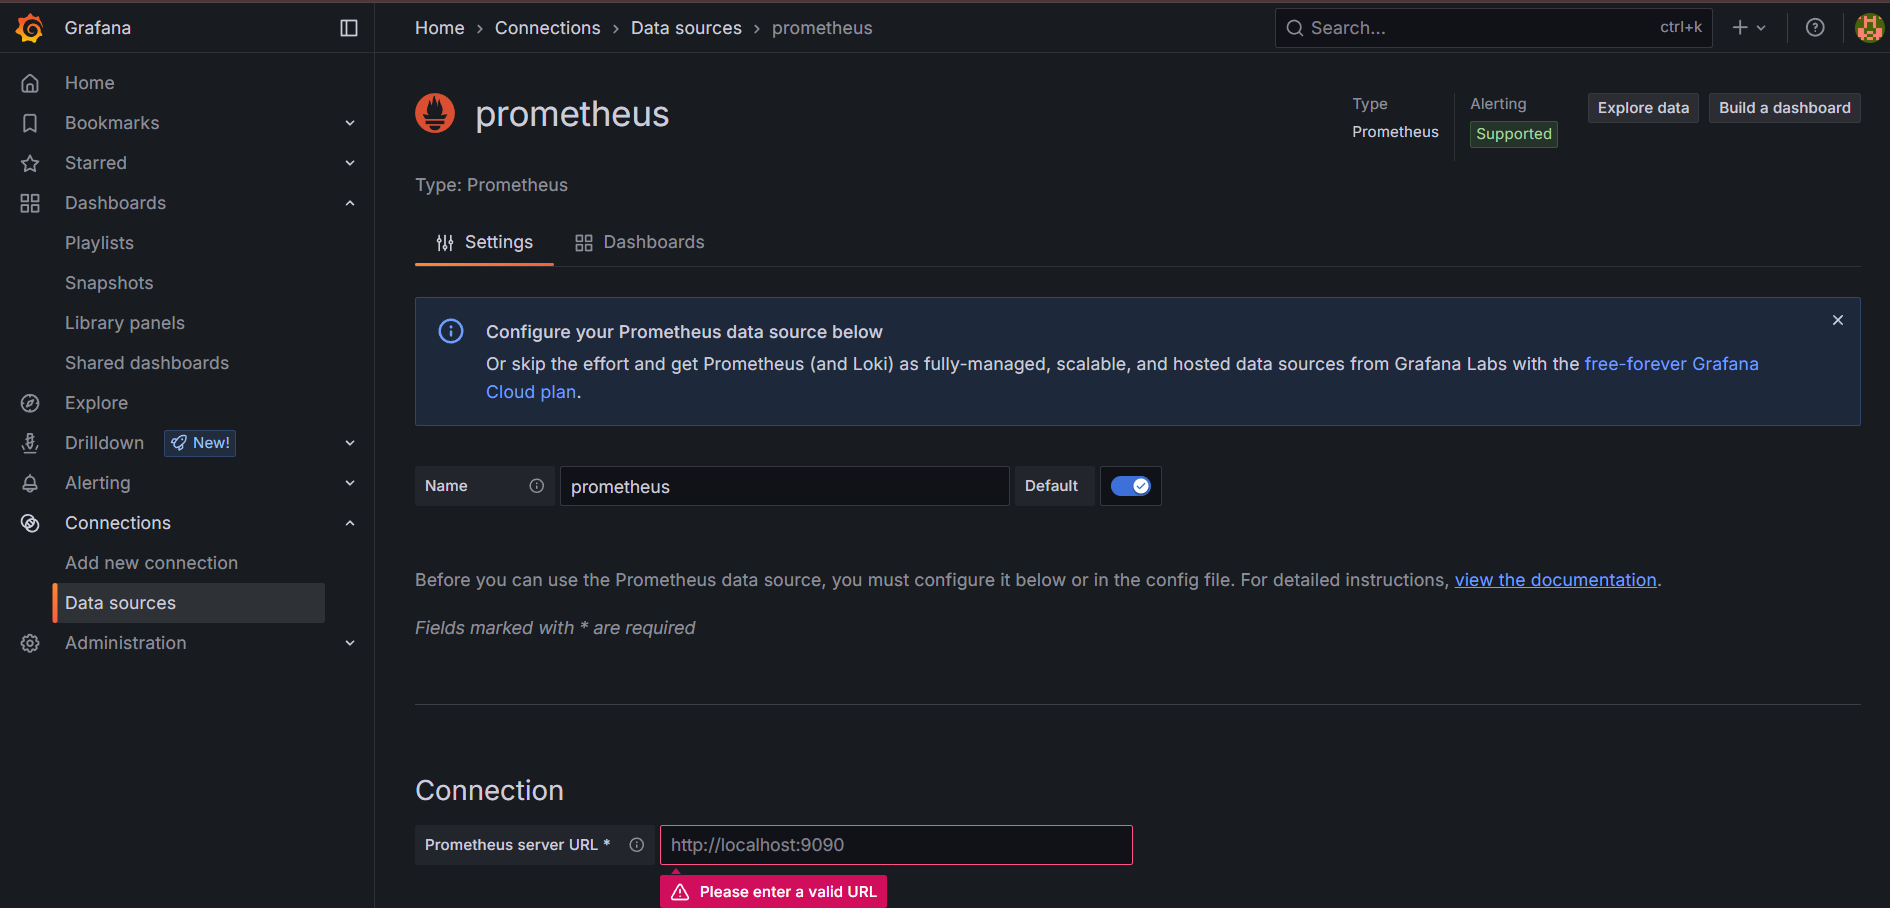
Click Save & test. A message will show that it connected.
-
Configure the Loki Data Source
Go to Connections → Data sources. Click Add new data source and choose Loki. Set the Loki server URL to:
http://loki:3100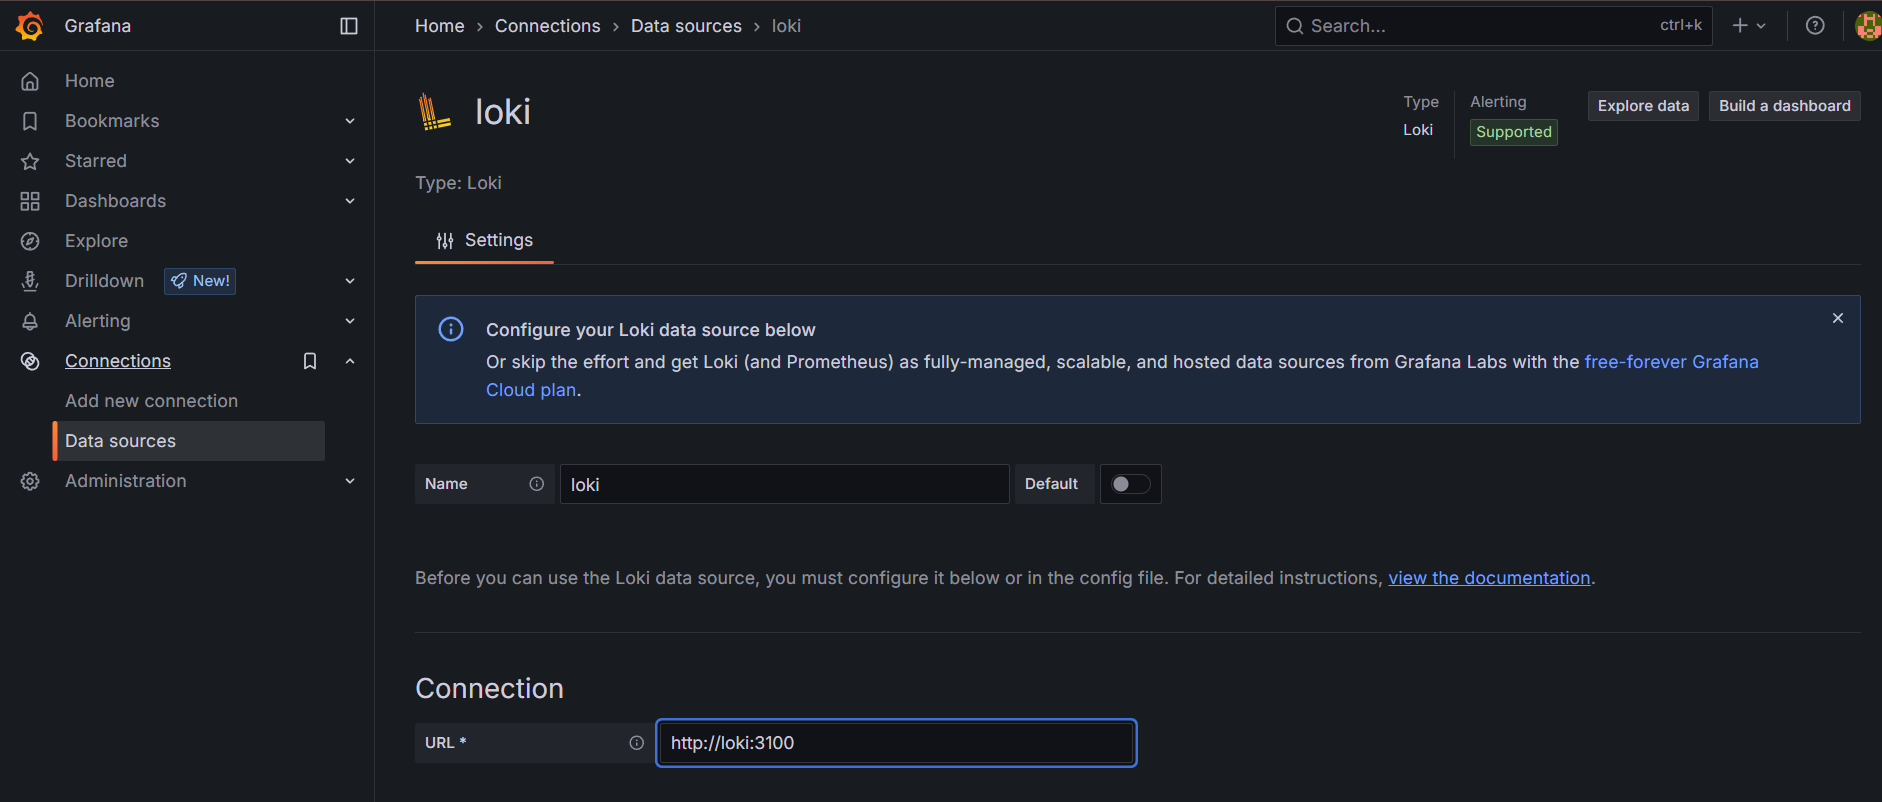
Click Save & test. A message will show that it connected.
Step 6: Verify Log Collection
-
After connecting Loki as a Grafana data source, verify that logs are being collected from your Docker containers.
-
Log in to Grafana and navigate to Explore. Select the Loki data source and run the following query:
{job="docker"}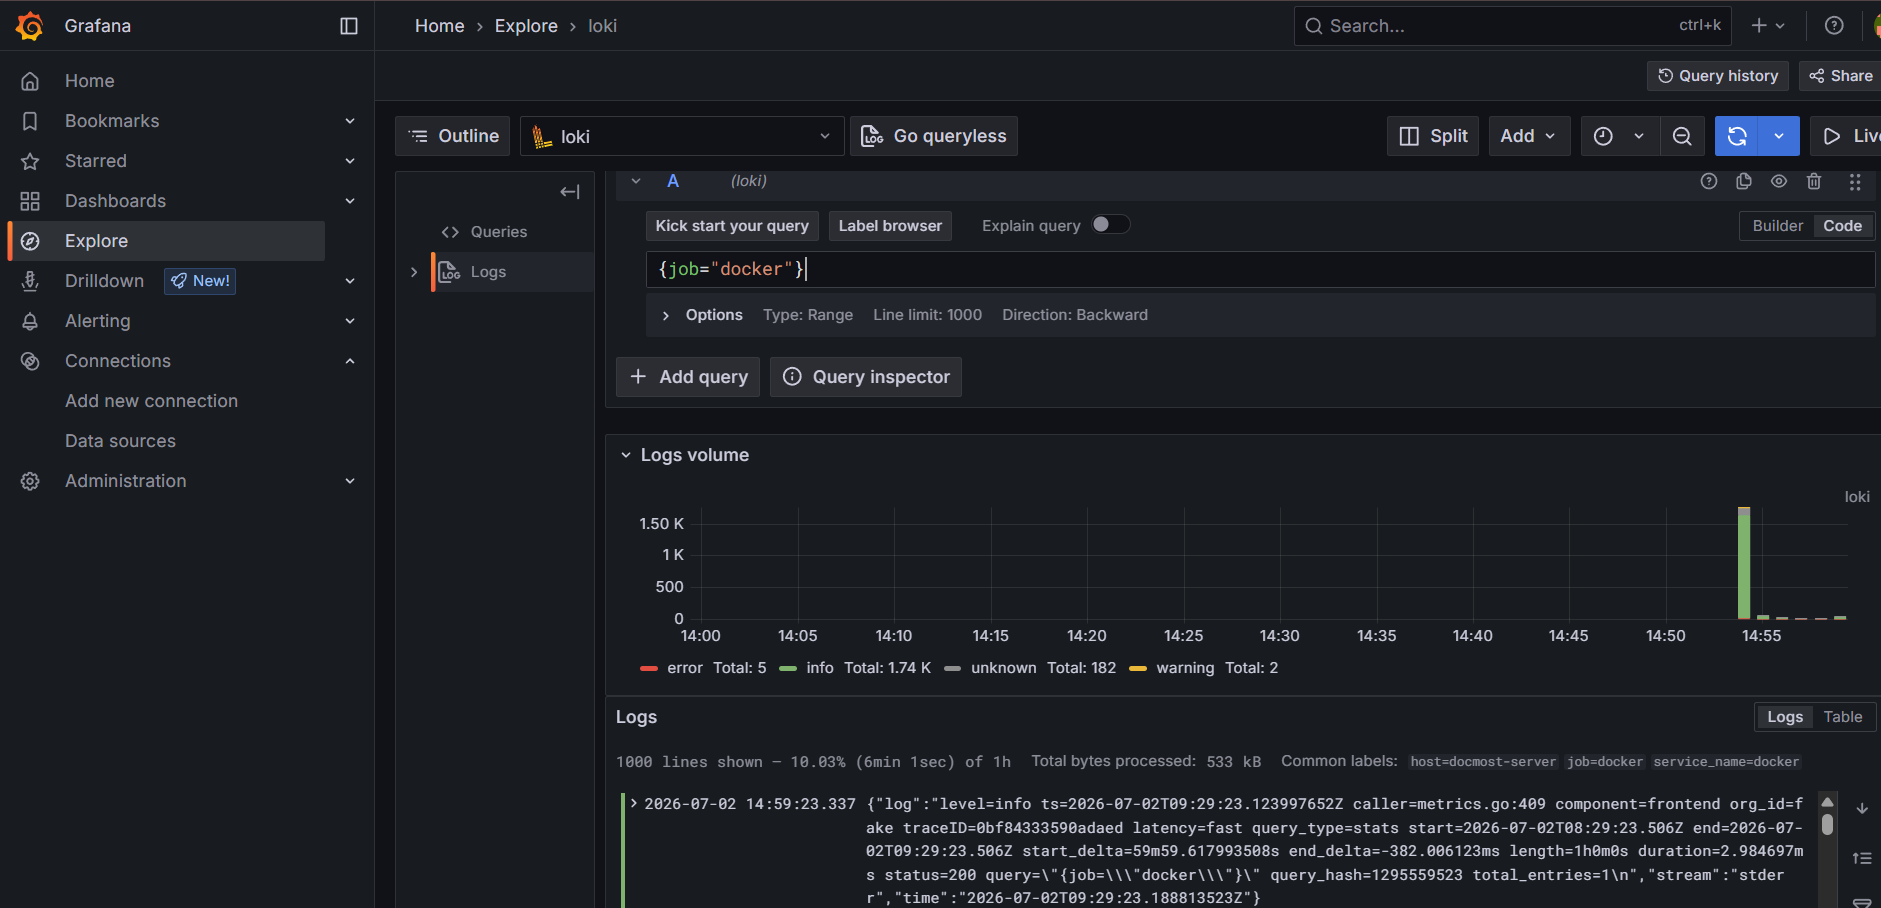
-
This query displays logs collected from all Docker containers running on the server.
-
To display only error logs, run the following query:
{job="docker"} |= "error"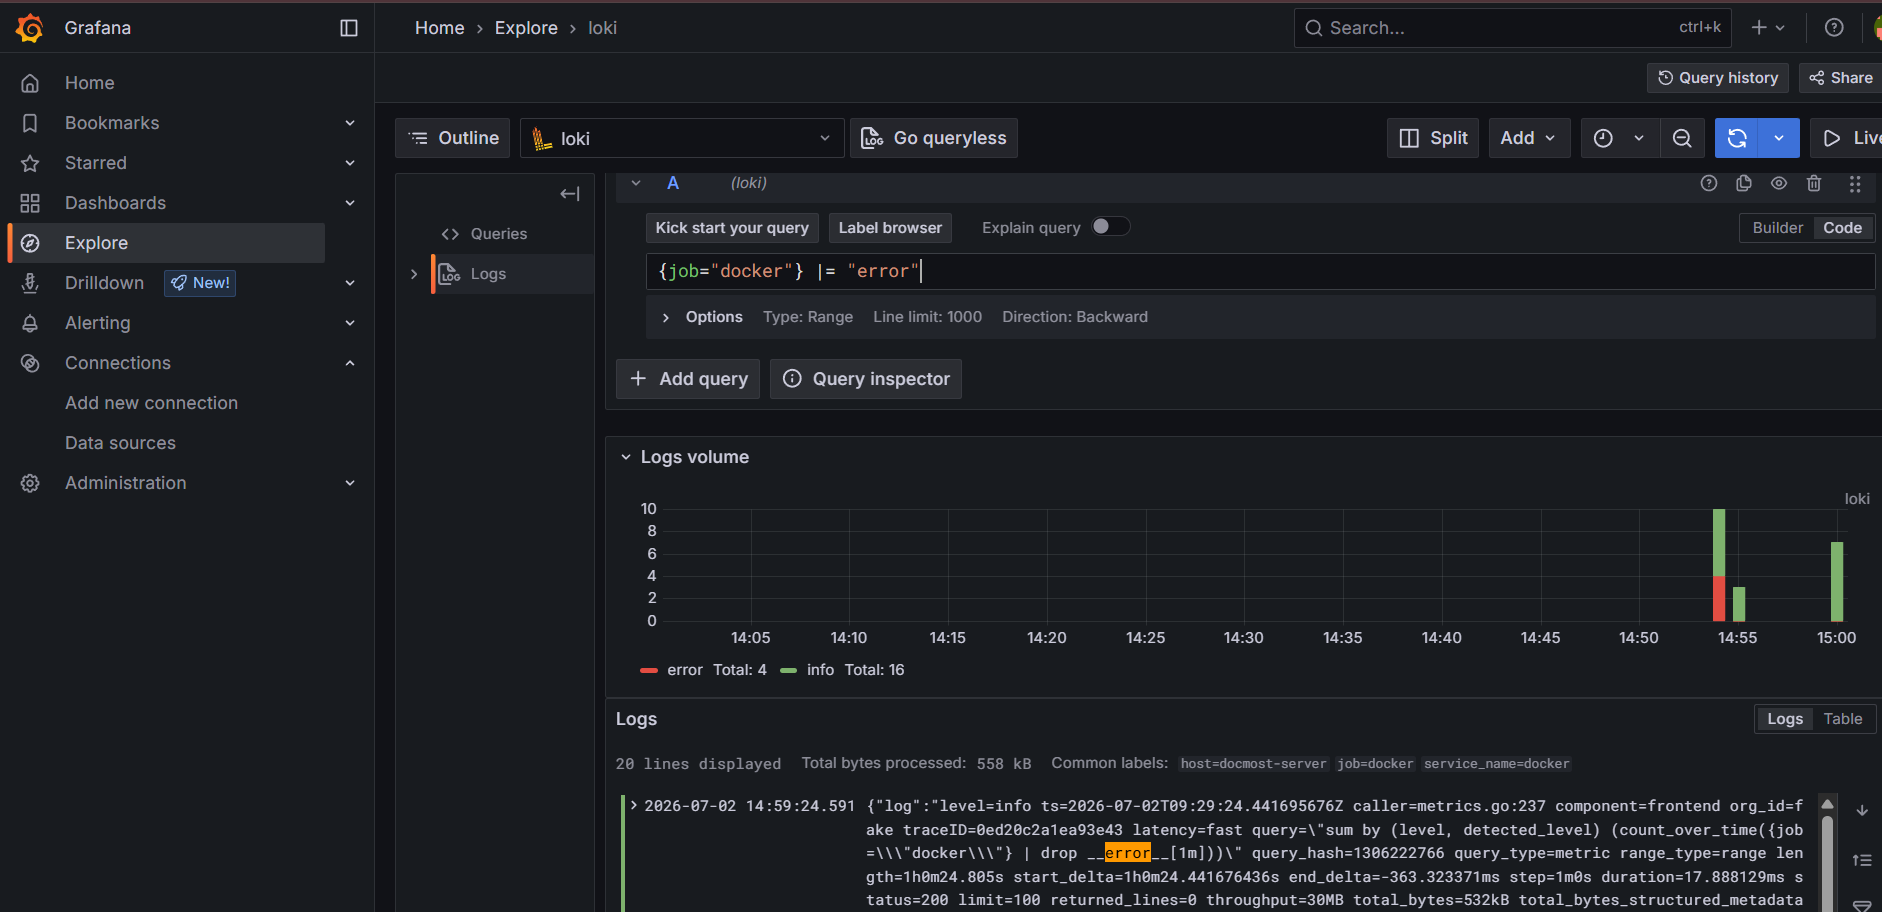
-
If log entries are displayed for both queries, your centralised logging stack is working correctly. Promtail is successfully collecting Docker container logs, forwarding them to Loki, and Grafana is able to query and display the logs.
Conclusion
In this guide, you added centralized logging to your Docmost monitoring stack using Loki, Promtail, and Grafana. You configured Loki to store logs, Promtail to collect logs from your Docker containers, and Grafana to query and analyze the collected logs. You also verified that container logs could be searched and filtered successfully.
With centralized logging in place, you can investigate application and container issues from a single interface alongside your existing metrics. The next step is to protect your Docmost data and prepare for recovery. Continue with the Back Up and Restore Docmost guide to back up your PostgreSQL database, uploaded files, and application configuration and verify that they can be restored successfully.