How to Monitor Docmost with Grafana and Prometheus
Once your Docmost server is secured, you also need to monitor its health and resource usage. Without monitoring, it can be difficult to identify high CPU or memory usage, disk space issues, container problems, or other issues before they affect your users. A monitoring stack with Prometheus and Grafana gives you a central place to collect and visualize these metrics.
In this guide, you'll deploy a monitoring stack for Docmost using Docker Compose. You'll configure Prometheus to collect metrics from the server and Docker containers using Node Exporter and cAdvisor, then use Grafana to visualize the metrics through dashboards. You'll also secure Prometheus and Grafana with Traefik and automatic HTTPS.
This article was tested on a live server before publication. Every command, configuration file, and verification step was validated on the final deployment to maintain accuracy.
Prerequisites
Before you begin, make sure you have the following:
-
A Running Docmost Instance: The server should have at least 2 vCPUs and 4 GB of RAM.
-
An External Managed PostgreSQL Database: A managed PostgreSQL instance configured as the Docmost database.
-
Docker and Docker Compose: Installed on your server to deploy Prometheus, Grafana, Node Exporter, and cAdvisor.
-
A Domain Name: Three subdomains with A records pointing to your server's public IP address (for example,
doc.example.com,prometheus.doc.example.com, andgrafana.doc.example.com). -
Open Ports 80 and 443: Required for Traefik to serve HTTPS traffic and automatically obtain SSL certificates from Let's Encrypt.
Infrastructure Used
This guide was validated using the following infrastructure:
- Cloud Provider: DigitalOcean
- Operating System: Ubuntu 24.04 LTS
- Deployment Environment: Virtual Machine (Droplet)
This guide contains affiliate links. If you sign up through these links, I may earn a commission at no additional cost to you. I only recommend products and services that I personally use while testing my guides.
Architecture Diagram
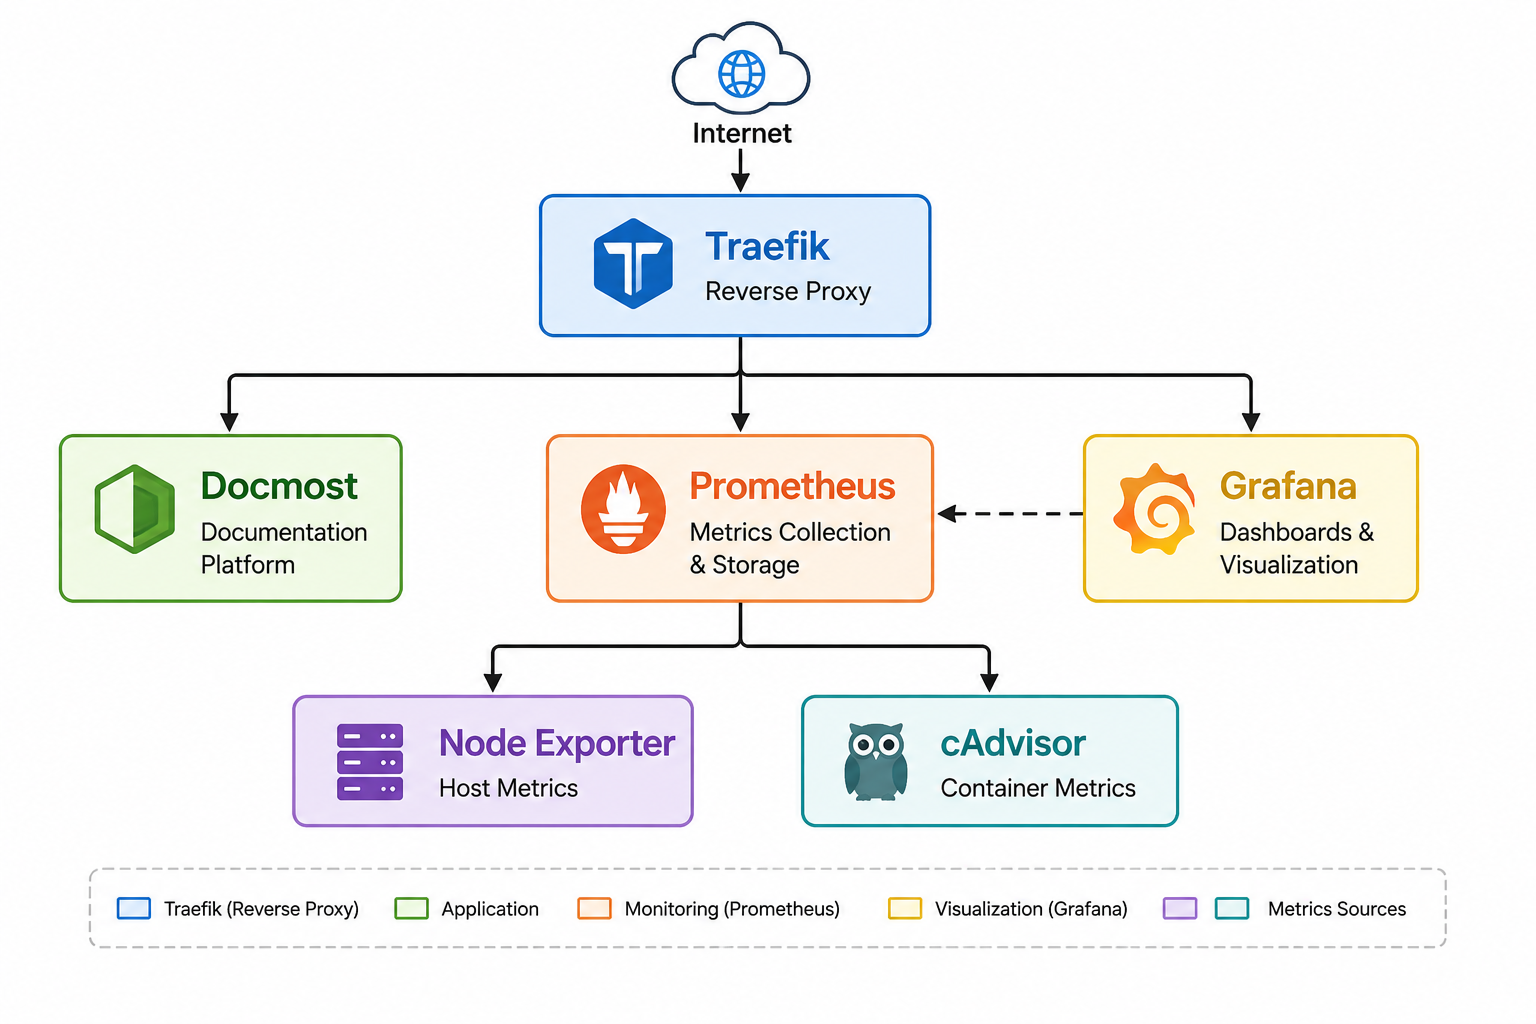
The architecture diagram below shows the monitoring setup used in this article. Client requests are routed through Traefik, which securely exposes Docmost, Prometheus, and Grafana over HTTPS. Prometheus collects host metrics from Node Exporter and container metrics from cAdvisor, storing them in its time-series database. Grafana then queries Prometheus to visualise these metrics through interactive dashboards, giving you real-time insights into server health, container performance, and the monitoring infrastructure itself.
Create a Non-Root Administrative User
Many cloud providers provide root access by default. While this is convenient for initial setup, production deployments are generally managed through a non-root user with sudo privileges. This follows Linux security best practices and reduces the risk of accidental system-wide changes.
-
Create a new user:
adduser USERNAMEReplace:
USERNAMEwith your preferred username.
-
Grant the user sudo privileges:
usermod -aG sudo USERNAMEReplace:
USERNAMEwith the username you created in the previous step.
-
Verify that the user has sudo access:
groups USERNAMEReplace:
USERNAMEwith the username you created in the previous step.
You should see output similar to:
USERNAME : USERNAME sudo -
Switch to the new user:
su - USERNAMEReplace:
USERNAMEwith the username you created in the previous step.
-
Verify sudo access:
sudo whoamiYou should see output similar to:
root -
Allow the user to manage Docker without using the root account:
sudo usermod -aG docker USERNAMEReplace:
USERNAMEwith the username you created in the previous step.
-
Apply the new Docker group to the current session:
newgrp docker
Step 1: Create the Project Directory and Configure Prometheus
Prometheus uses a configuration file to define the metrics it collects, while environment variables store the application settings, domain information, and Grafana credentials. In this step, you'll create a dedicated project directory, write the Prometheus configuration, and define the environment variables used throughout the deployment.
-
Create the project directory and navigate to it:
mkdir ~/docmost-monitoringcd ~/docmost-monitoringThis directory will contain all files related to the deployment, including the Docker Compose manifest, Prometheus configuration, and environment variables.
-
Create the Prometheus configuration directory:
mkdir prometheusnano prometheus/prometheus.ymlAdd the following configuration:
global:scrape_interval: 15sevaluation_interval: 15sscrape_configs:- job_name: "prometheus"static_configs:- targets:- "prometheus:9090"- job_name: "node-exporter"static_configs:- targets:- "node-exporter:9100"- job_name: "cadvisor"static_configs:- targets:- "cadvisor:8080" -
Generate a secure secret:
openssl rand -hex 32Copy the generated output and paste it into the
APP_SECRETvariable in the next step. -
Create the environment file:
nano .envAdd the following configuration:
# Website ConfigurationDOMAIN_NAME=doc.example.comAPP_URL=https://doc.example.comLETSENCRYPT_EMAIL=your_email@example.com# Global Application SecretAPP_SECRET=YOUR_GENERATED_SECRET# PostgreSQL ConfigurationDATABASE_URL=DATABASE_CONNECTION_STRING# Redis ConfigurationREDIS_URL=redis://redis:6379# Grafana ConfigurationGRAFANA_ADMIN_USER=adminGRAFANA_ADMIN_PASSWORD=YOUR_GRAFANA_PASSWORDReplace the following values:
-
doc.example.comwith your domain name. -
your_email@example.comwith your email address used for SSL certificate notifications. -
DATABASE_CONNECTION_STRINGwith your PostgreSQL connection string. -
YOUR_GENERATED_SECRETwith the secret generated in the previous step. -
YOUR_GRAFANA_PASSWORDwith a strong password for the Grafana administrator account.
-
Step 2: Create the Docker Compose File
The deployment consists of seven containers. Traefik handles HTTPS traffic and SSL certificate management. Docmost runs the application, Redis provides caching and background job processing, Prometheus collects metrics, Grafana visualises the metrics, Node Exporter exposes host metrics, and cAdvisor exposes Docker container metrics.
-
Create the Docker Compose file:
nano docker-compose.ymlAdd the following configuration:
services:traefik:image: traefik:v3.6command:- "--providers.docker=true"- "--providers.docker.exposedbydefault=false"- "--providers.docker.network=monitoring"- "--entrypoints.web.address=:80"- "--entrypoints.websecure.address=:443"- "--entrypoints.web.http.redirections.entryPoint.to=websecure"- "--certificatesresolvers.letsencrypt.acme.httpchallenge=true"- "--certificatesresolvers.letsencrypt.acme.httpchallenge.entrypoint=web"- "--certificatesresolvers.letsencrypt.acme.email=${LETSENCRYPT_EMAIL}"- "--certificatesresolvers.letsencrypt.acme.storage=/letsencrypt/acme.json"ports:- "80:80"- "443:443"volumes:- /var/run/docker.sock:/var/run/docker.sock:ro- letsencrypt:/letsencryptsecurity_opt:- no-new-privileges:truerestart: unless-stoppednetworks:- monitoringdocmost:image: docmost/docmost:latestdepends_on:- redisenvironment:APP_URL: ${APP_URL}APP_SECRET: ${APP_SECRET}DATABASE_URL: ${DATABASE_URL}REDIS_URL: ${REDIS_URL}volumes:- docmost:/app/data/storagelabels:- "traefik.enable=true"- "traefik.http.routers.docmost.rule=Host(`${DOMAIN_NAME}`)"- "traefik.http.routers.docmost.entrypoints=websecure"- "traefik.http.routers.docmost.tls.certresolver=letsencrypt"- "traefik.http.services.docmost.loadbalancer.server.port=3000"security_opt:- no-new-privileges:truerestart: unless-stoppednetworks:- monitoringredis:image: redis:8command:- redis-server- --appendonly- "yes"- --maxmemory-policy- noevictionvolumes:- redis_data:/datasecurity_opt:- no-new-privileges:truerestart: unless-stoppednetworks:- monitoringnode-exporter:image: prom/node-exporter:v1.11.1command:- "--path.rootfs=/host"volumes:- "/:/host:ro,rslave"pid: hostrestart: unless-stoppednetworks:- monitoringcadvisor:image: gcr.io/cadvisor/cadvisor:v0.52.1privileged: truedevices:- /dev/kmsgvolumes:- "/:/rootfs:ro"- "/var/run:/var/run:ro"- "/sys:/sys:ro"- "/var/lib/docker:/var/lib/docker:ro"- "/dev/disk:/dev/disk:ro"restart: unless-stoppednetworks:- monitoringprometheus:image: prom/prometheus:v3.5.0command:- "--config.file=/etc/prometheus/prometheus.yml"- "--storage.tsdb.path=/prometheus"volumes:- ./prometheus/prometheus.yml:/etc/prometheus/prometheus.yml:ro- prometheus_data:/prometheuslabels:- "traefik.enable=true"- "traefik.http.routers.prometheus.rule=Host(`prometheus.${DOMAIN_NAME}`)"- "traefik.http.routers.prometheus.entrypoints=websecure"- "traefik.http.routers.prometheus.tls.certresolver=letsencrypt"- "traefik.http.services.prometheus.loadbalancer.server.port=9090"security_opt:- no-new-privileges:truerestart: unless-stoppednetworks:- monitoringgrafana:image: grafana/grafana:12.0.2depends_on:- prometheusenvironment:GF_SECURITY_ADMIN_USER: ${GRAFANA_ADMIN_USER}GF_SECURITY_ADMIN_PASSWORD: ${GRAFANA_ADMIN_PASSWORD}volumes:- grafana_data:/var/lib/grafanalabels:- "traefik.enable=true"- "traefik.http.routers.grafana.rule=Host(`grafana.${DOMAIN_NAME}`)"- "traefik.http.routers.grafana.entrypoints=websecure"- "traefik.http.routers.grafana.tls.certresolver=letsencrypt"- "traefik.http.services.grafana.loadbalancer.server.port=3000"security_opt:- no-new-privileges:truerestart: unless-stoppednetworks:- monitoringvolumes:docmost:redis_data:letsencrypt:prometheus_data:grafana_data:networks:monitoring:driver: bridge
Step 3: Deploy the Application
Docker Compose will pull the required images, create the Docker network and persistent volumes, and start all services required for the monitoring stack.
-
Start the deployment:
docker compose up -d
The first deployment may take a few minutes while Docker downloads the required container images.
-
Verify that all containers are running:
docker compose psYou should see the
traefik,docmost,redis,node-exporter,cadvisor,prometheus, andgrafanacontainers in anUpstate. -
Review the application logs:
docker compose logsTo view the logs for a specific service, use:
docker compose logs <service-name>For example, to view the Prometheus logs:
docker compose logs prometheusYou can replace
prometheuswithdocmost,grafana,traefik,node-exporter,cadvisor, orredisto review the logs for that service.
Step 4: Deployment Verification
Once all containers are running, you'll verify that Docmost, Prometheus, and Grafana are accessible over HTTPS.
-
Verify Docmost: Open your browser and navigate to your configured domain:
https://doc.example.comReplace:
doc.example.comwith your actual domain name.
-
Verify Prometheus: Open your browser and navigate to your Prometheus subdomain:
https://prometheus.doc.example.comReplace:
doc.example.comwith your actual domain name.
-
Verify Grafana: Open your browser and navigate to your Grafana subdomain:
https://grafana.doc.example.comReplace:
doc.example.comwith your actual domain name.
Log in using the Grafana administrator credentials you configured in the
.envfile. After logging in, confirm that you can reach the Grafana home dashboard before continuing to the next step.
Step 5: Import Grafana Dashboards
Before importing the dashboards, you need to connect Prometheus as a Grafana data source.
-
Configure the Prometheus Data Source
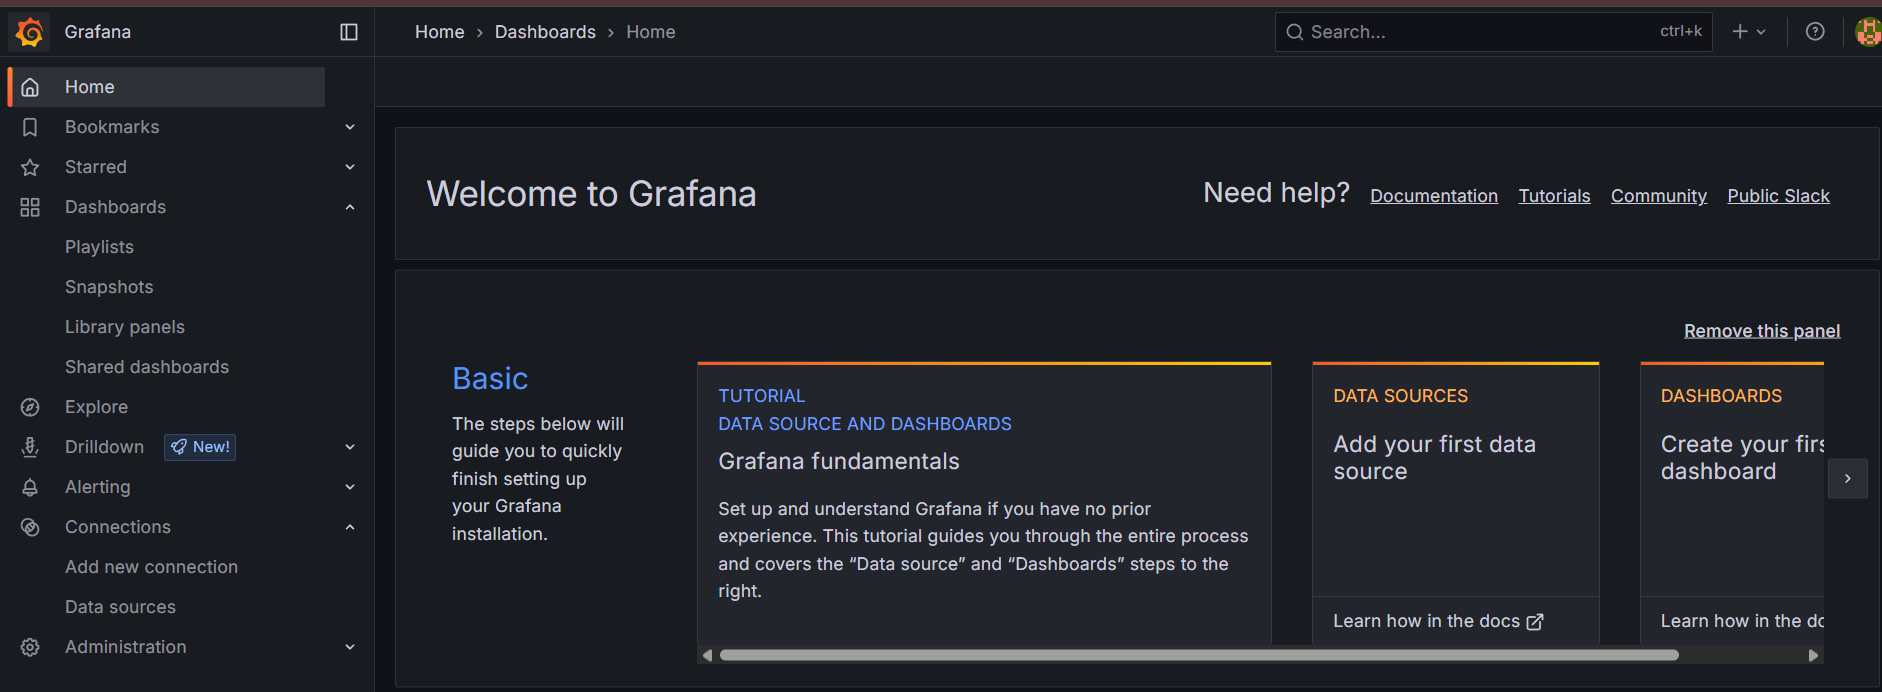
Log in to Grafana and navigate to Connections → Data sources. Click Add new data source and select Prometheus. Set the Prometheus server URL to:
http://prometheus:9090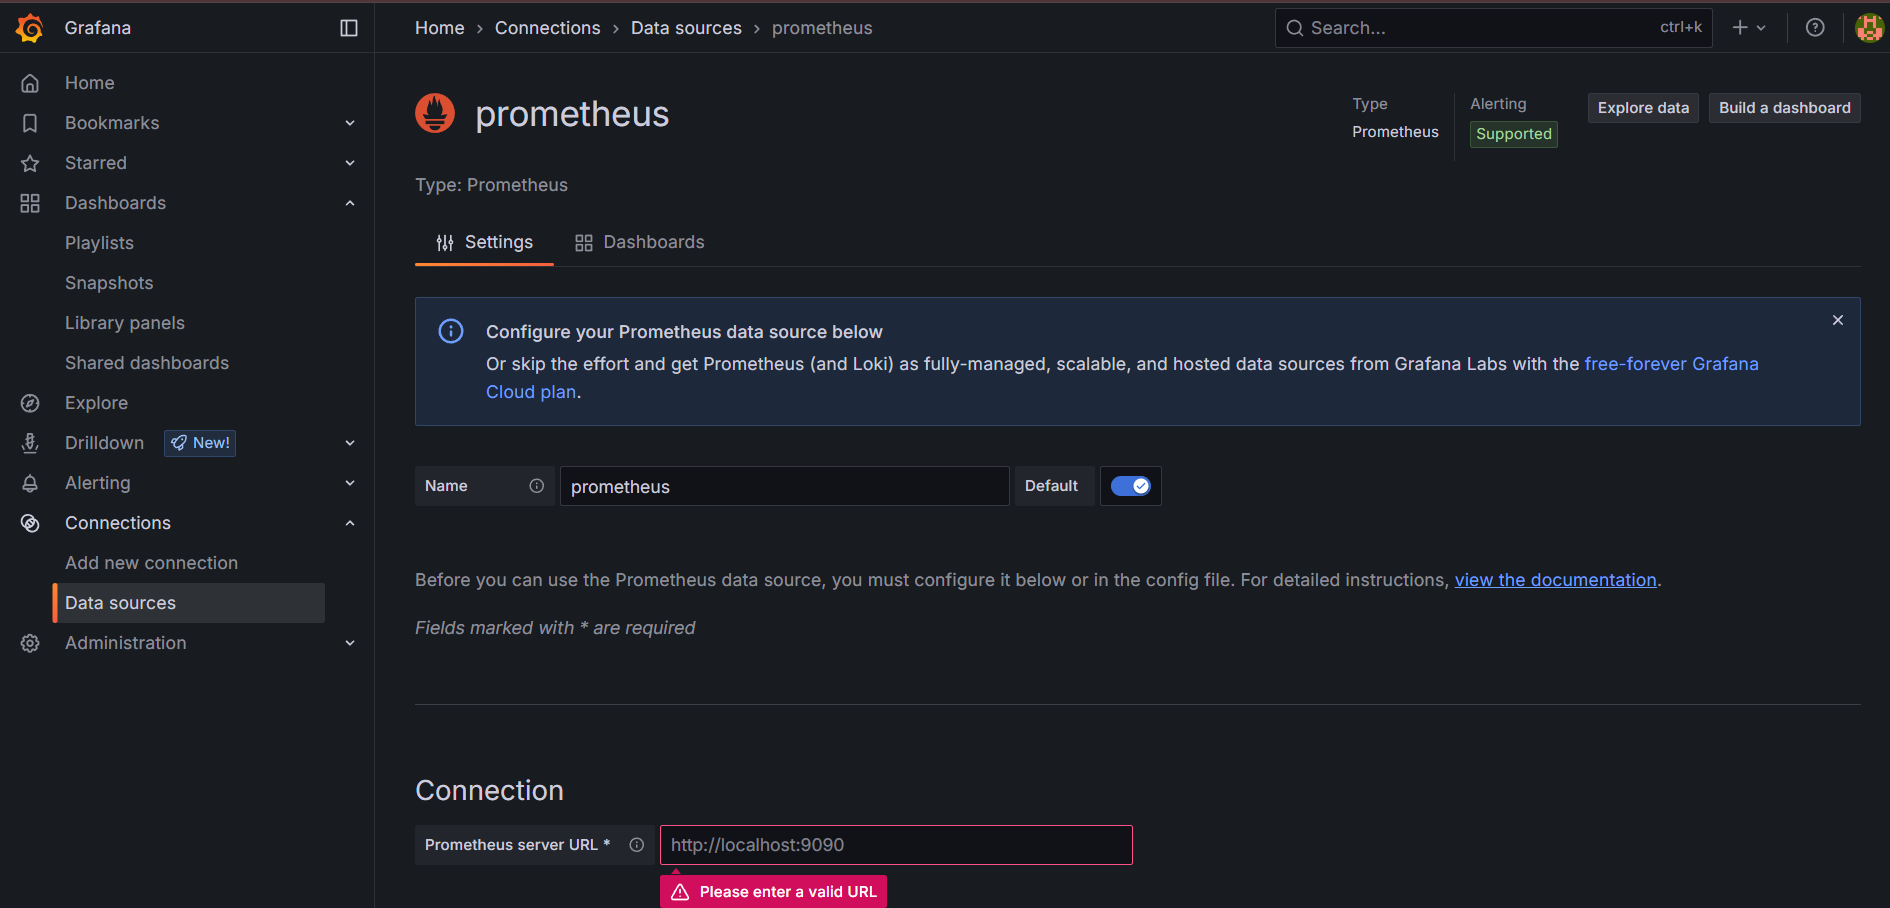
Click Save & test. You should see a confirmation that the data source is connected successfully.
-
Import the Node Exporter Full Dashboard
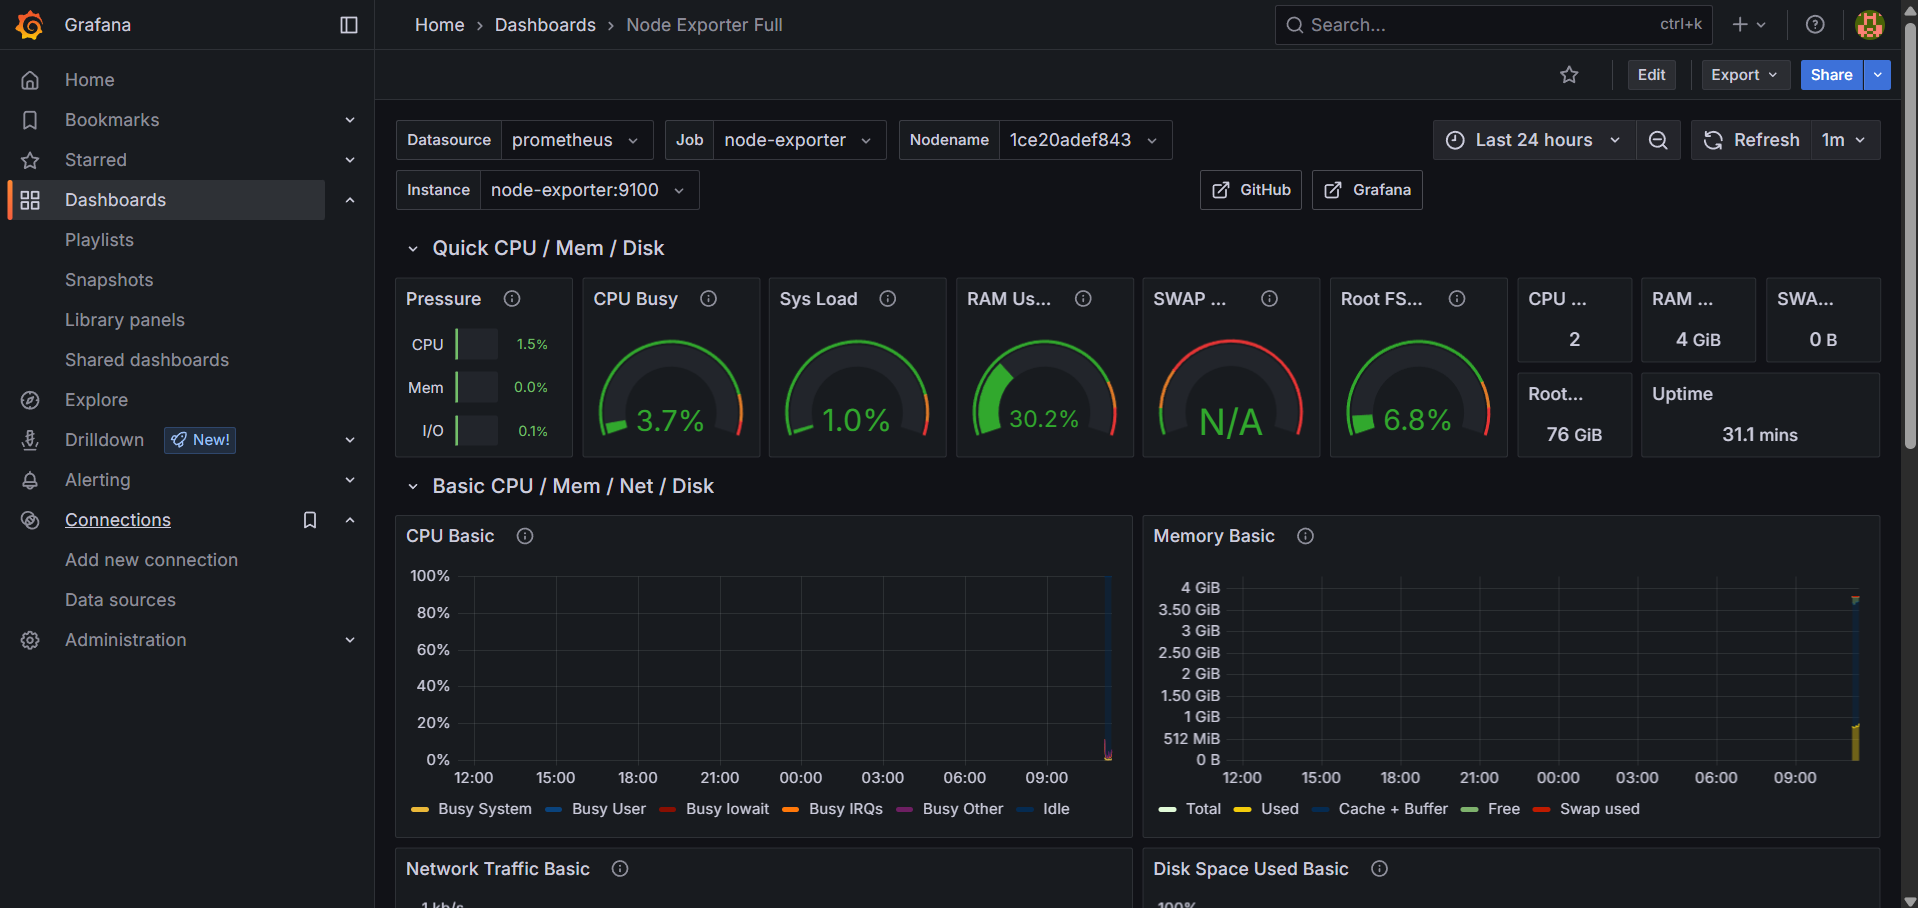
The Node Exporter Full dashboard displays host-level metrics including CPU usage, memory utilisation, disk usage, network traffic, and system load.
From the Grafana sidebar, navigate to Dashboards → New → Import. Enter the following dashboard ID:
1860Select the Prometheus data source and click Import.
-
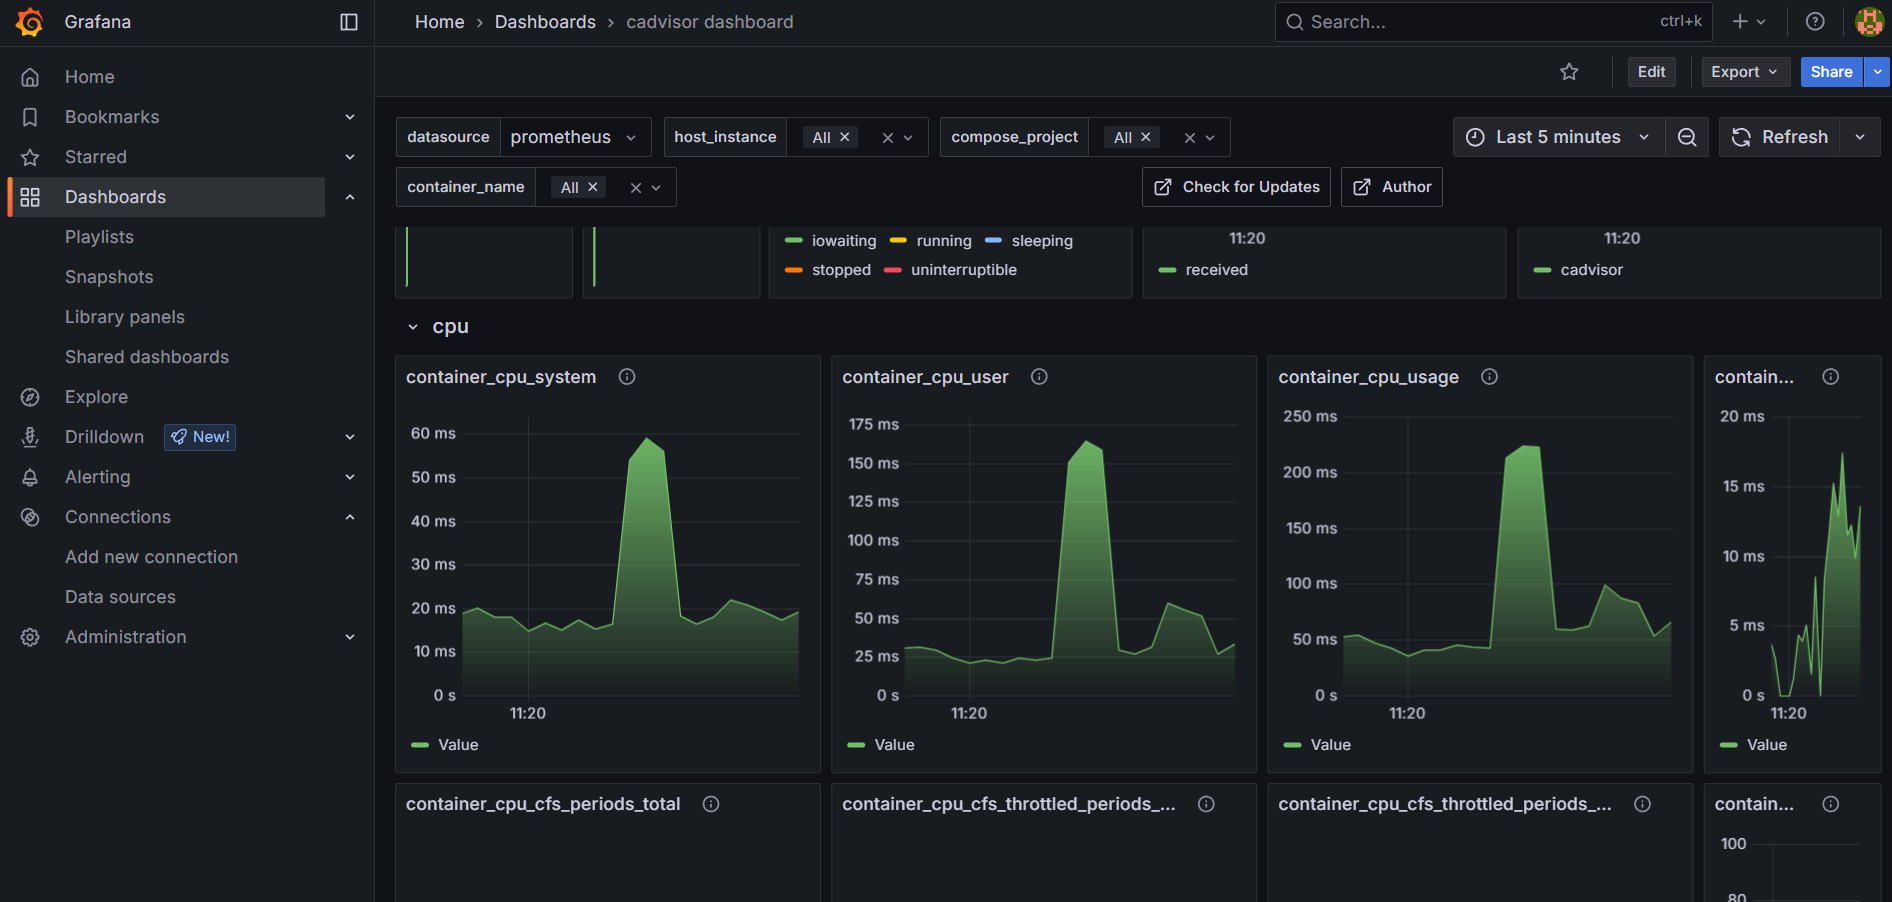
Import the cAdvisor Dashboard
The cAdvisor dashboard displays container-level metrics, including CPU usage, memory consumption, network traffic, and filesystem utilisation for each Docker container.
From the Grafana sidebar, navigate to Dashboards → New → Import. Enter the following dashboard ID:
19792Select the Prometheus data source and click Import.
-
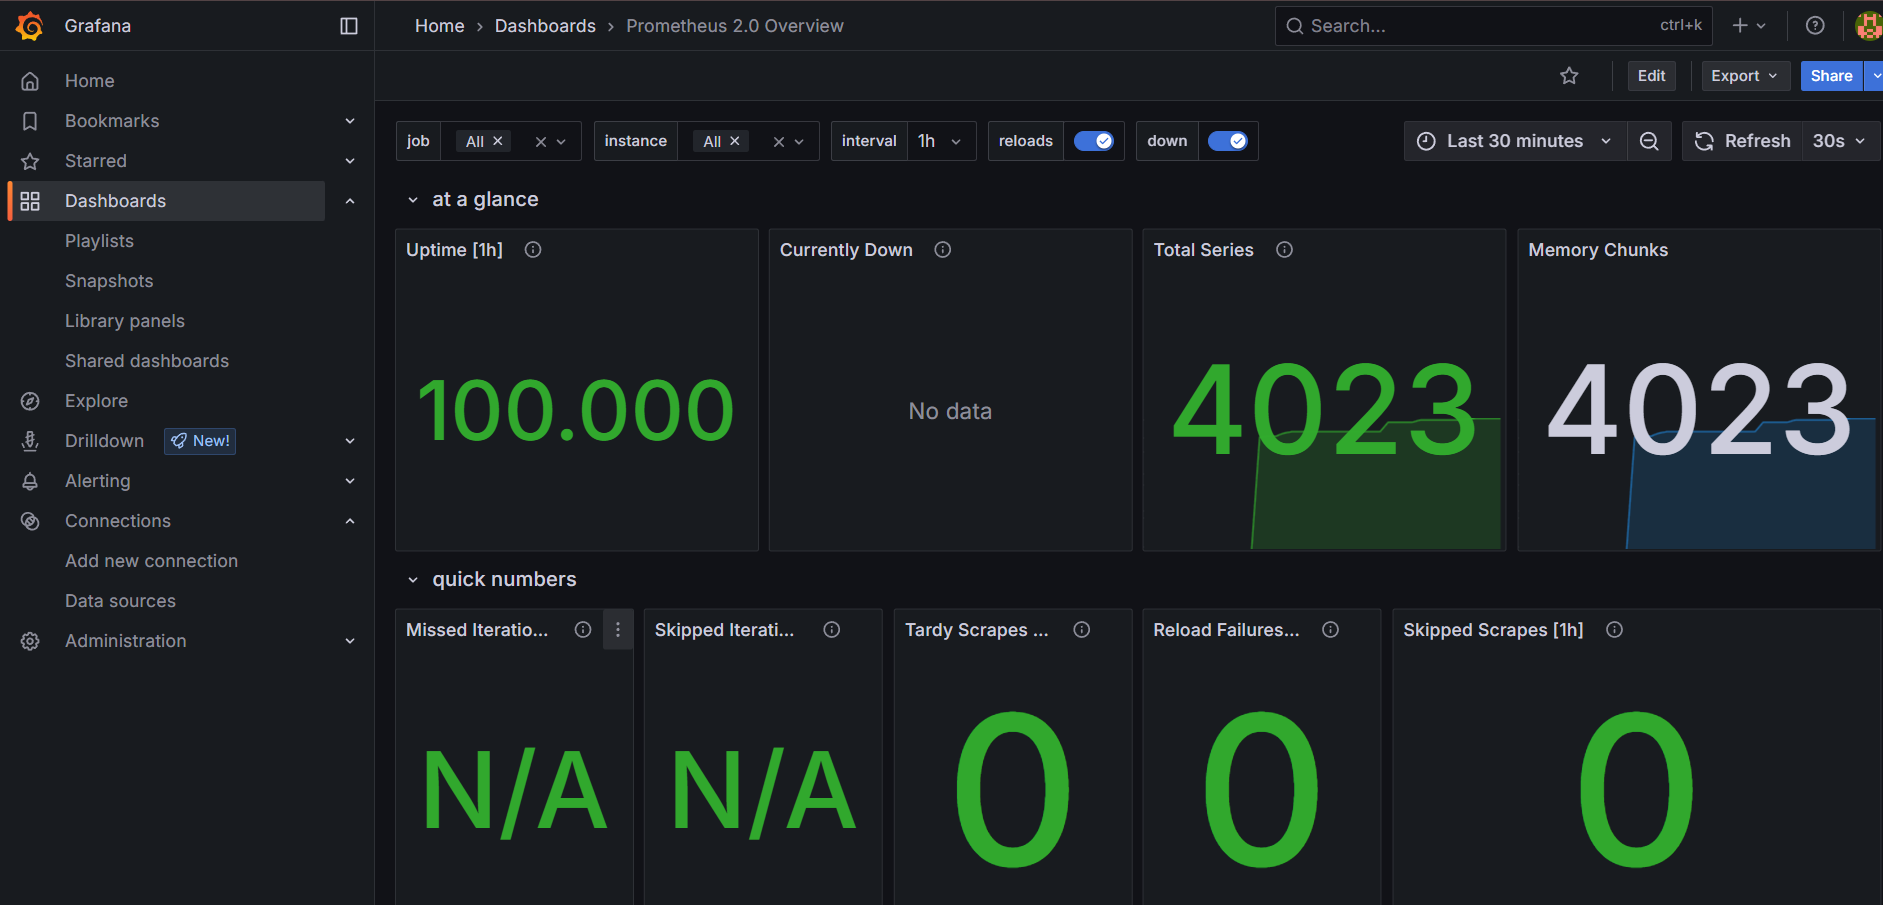
Import the Prometheus 2.0 Overview Dashboard
The Prometheus 2.0 Overview dashboard displays metrics for your Prometheus server, including scrape status, storage usage, query performance, and target health.
From the Grafana sidebar, navigate to Dashboards → New → Import. Enter the following dashboard ID:
3662Select the Prometheus data source and click Import.
Troubleshooting
-
Prometheus Targets Are Down: If one or more targets appear as
DOWNin the Prometheus targets page, you may see an error similar to the following:State: DOWNError: Get "http://node-exporter:9100/metrics": dial tcp: lookup node-exporter: no such hostFix: Verify that all containers are running and that the service names in
prometheus.ymlmatch the Docker Compose service names exactly. Restart the monitoring stack after making any configuration changes:docker compose downdocker compose up -d -
Grafana Cannot Connect to Prometheus: If the Prometheus data source test fails in Grafana, you may see an error similar to the following:
Post "http://wrongurl:9090/api/v1/query": dial tcp: lookup wrongurl: no such hostFix: Navigate to Connections → Data sources, select your Prometheus data source, and verify that the server URL is set to:
http://prometheus:9090Click Save & test to verify the connection.
-
Node Exporter Dashboard Shows "No Data"
If the Node Exporter Full dashboard displays No data across all panels, the dashboard may be pointing at the wrong data source or job.
Fix: Open the dashboard settings and confirm that the Prometheus data source is selected and the
Jobvariable is set tonode-exporter. You can also confirm that Prometheus is collecting metrics by running the following query in Grafana → Explore:upThe
node-exportertarget should return a value of1. -
SSL Certificate Is Not Issued
If Traefik serves a self-signed certificate instead of a Let's Encrypt certificate, your browser will show a warning similar to the following:
Your connection is not privateNET::ERR_CERT_AUTHORITY_INVALIDorNET::ERR_CERT_COMMON_NAME_INVALIDFix: Verify that your DNS records point to your server's public IP address and that ports 80 and 443 are open. You can check port access with:
sudo ufw statusIf UFW is enabled, allow HTTP and HTTPS traffic:
sudo ufw allow 80sudo ufw allow 443Review the Traefik logs for certificate-related errors:
docker compose logs traefikOnce DNS propagation is complete and the required ports are accessible, Traefik will automatically request and install a valid SSL certificate from Let's Encrypt.
Conclusion
In this guide, you deployed a monitoring stack for Docmost using Docker Compose. You configured Prometheus to collect metrics from the server and Docker containers using Node Exporter and cAdvisor, then used Grafana to visualize the collected metrics through dashboards. You also secured Prometheus and Grafana with Traefik and automatic Let's Encrypt SSL certificates.
With monitoring in place, you can track server and container resource usage from Grafana and identify issues such as high CPU or memory usage, unavailable containers, and other resource-related problems. The next step is to centralize your application and container logs. Continue with the Add Centralized Logging with Loki and Promtail guide to collect, search, and analyze logs from your Docmost deployment in Grafana.