Instrument a Node.js Express Application with OpenTelemetry and SigNoz: A Complete Guide
Modern Node.js applications often use databases, caches, and other services to process requests. When an application becomes slow or encounters errors, logs alone rarely provide enough information to identify the root cause. OpenTelemetry provides a standard way to collect telemetry data, while SigNoz is an open-source observability platform that helps you collect, visualize, and analyze distributed traces. Together, they make it easier to understand application behavior, monitor performance, and troubleshoot issues.
In this tutorial, you'll build an Express.js application instrumented with OpenTelemetry and export traces to SigNoz. You'll integrate PostgreSQL for data storage and Redis for caching, then use SigNoz to visualize HTTP requests, database queries, and cache operations. By the end of this guide, you'll have a complete observability pipeline for monitoring and troubleshooting your Node.js application.
This article was tested on a live server before publication. Every command, configuration file, and verification step was validated on the final deployment to maintain accuracy.
Prerequisites
Before you begin, make sure you have the following:
- An Ubuntu 24.04 server with at least 4 vCPUs and 8 GB RAM.
- Node.js 20 or later installed.
- Docker Engine and the Docker Compose plugin installed.
- Basic familiarity with JavaScript and Express.js.
Infrastructure Used
This guide was validated using the following infrastructure:
- Cloud Provider: DigitalOcean
- Operating System: Ubuntu 24.04 LTS
- Deployment Environment: Virtual Machine (Droplet)
This guide contains affiliate links. If you sign up through these links, I may earn a commission at no additional cost to you. I only recommend products and services that I personally use while testing my guides.
Architecture Overview
The application uses PostgreSQL to store user data and Redis to cache frequently requested data. As requests pass through the application, OpenTelemetry automatically captures telemetry data and sends it to SigNoz, where you can visualize request traces, database queries, and cache operations.
              HTTP Request
                  │
                  ▼
         ┌────────────────┐
         │ Express.js App │
         └────────┬───────┘
                  │
      ┌───────────┴───────────┐
      ▼                       ▼
 PostgreSQL              Redis Cache
      │                       │
      └───────────┬───────────┘
                  │
          OpenTelemetry SDK
                  │
          OTLP (gRPC:4317)
                  │
                  ▼
     ┌─────────────────────────┐
     │ OpenTelemetry Collector │
     │    (SigNoz Collector)   │
     └────────────┬────────────┘
                  ▼
           ┌────────────┐
           │   SigNoz   │
           │ Dashboard  │
           └────────────┘
Step 1: Install SigNoz
Before instrumenting the Express.js application, you need an observability backend to collect, store, and visualize telemetry data. In this step, you'll deploy SigNoz using the foundryctl CLI and verify that it's ready to receive traces from your application.
-
Install the Foundry CLI and add it to your current shell's
PATH.curl -fsSL https://signoz.io/foundry.sh | bashexport PATH="/root/.local/bin:$PATH" -
Verify that the installation completed successfully.
foundryctl version -
Create a file named
casting.yamlwith the following configuration.apiVersion: v1alpha1kind: Installationmetadata:name: signozspec:deployment:flavor: composemode: dockerThis configuration instructs
foundryctlto deploy SigNoz using Docker Compose. -
Deploy SigNoz using the installation configuration.
foundryctl cast -f casting.yamlThe installer validates your Docker environment, generates the required Docker Compose resources, and starts the SigNoz services.
-
Verify that the deployment completed successfully.
docker psYou should see containers such as
signoz-frontend,signoz-query-service,signoz-otel-collector, andclickhouse. -
Open the SigNoz dashboard in your browser.
http://<SERVER-IP>:8080Replace
<SERVER-IP>with your server's IP address. If the installation completed successfully, the SigNoz setup page should load. Create the initial administrator account to access the dashboard.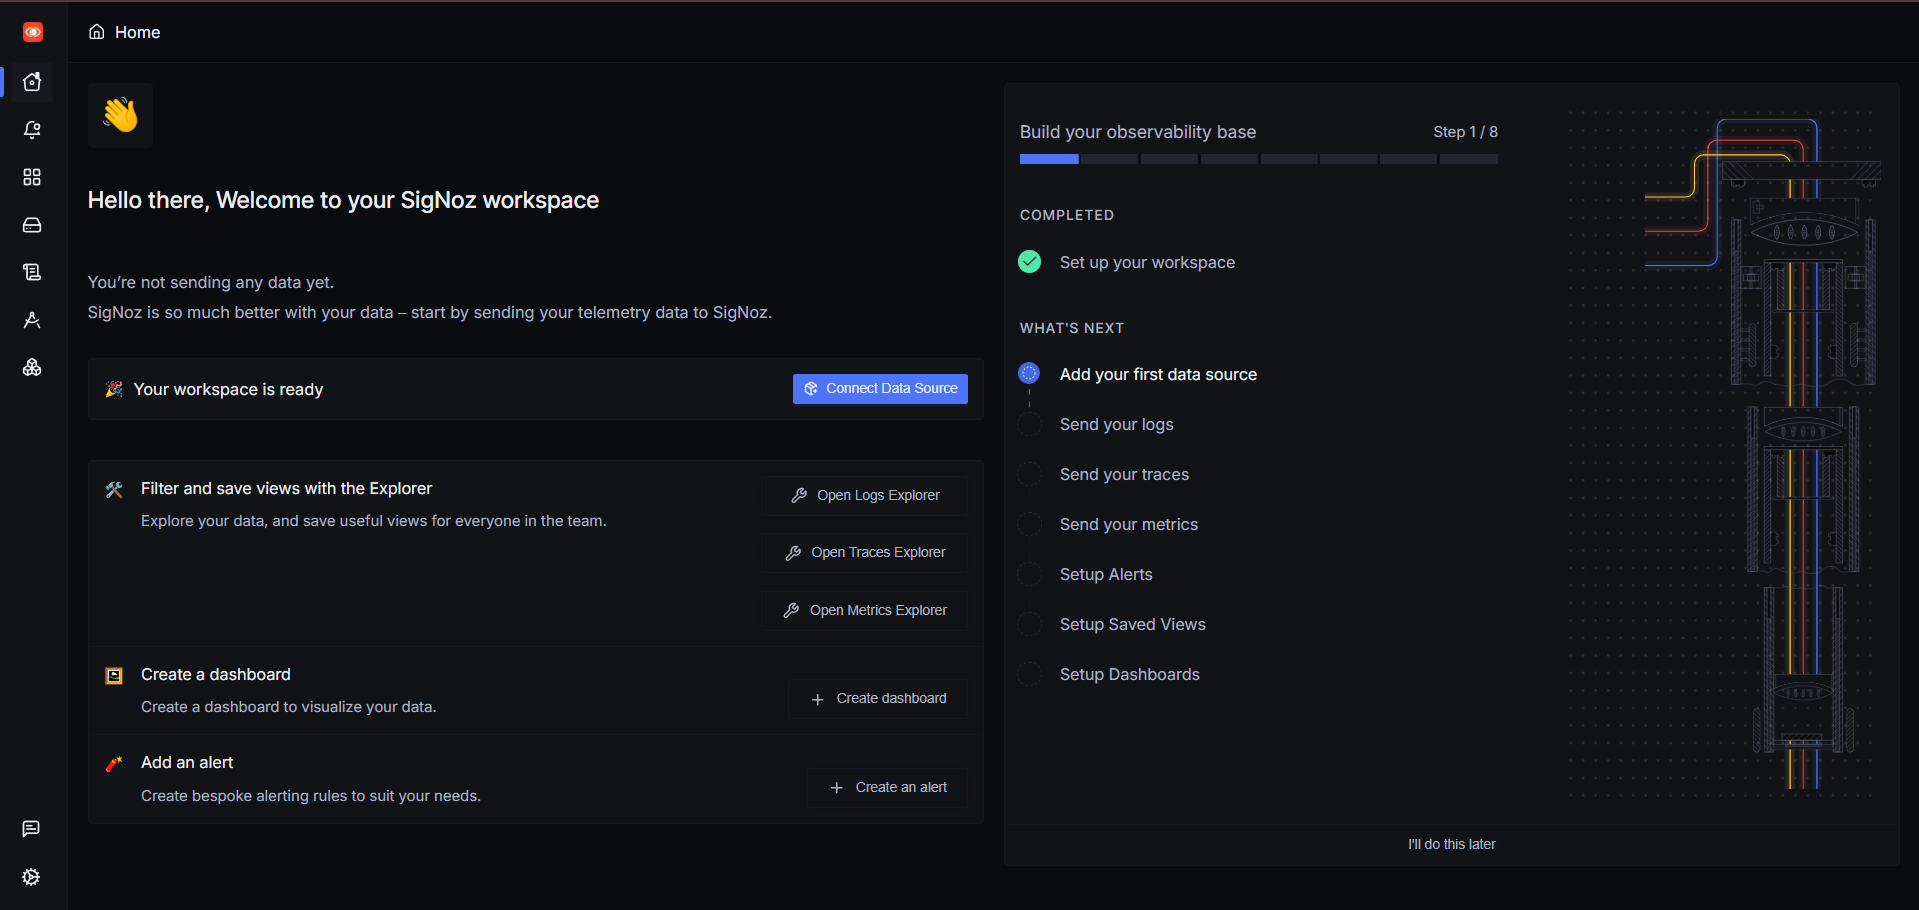
Step 2: Create the Express.js Application
Create a simple Express.js application that you'll instrument throughout this tutorial. You'll initialize a new Node.js project, install the required dependencies, and create a basic application that serves as the foundation for the remaining steps.
-
Create a project directory and navigate into it.
mkdir express-observabilitycd express-observability -
Initialize a new Node.js project.
npm init -y -
Install the application dependencies.
npm install express helmet cors morgan dotenv pg redis -
Install the development dependency.
npm install --save-dev nodemon -
Create the project structure.
mkdir -p src/{controllers,routes,db,cache,telemetry}touch src/app.jstouch src/server.jstouch .env -
Verify that the project structure was created successfully.
tree -L 2 -I node_modulesIf the
treecommand is not installed, install it using:sudo apt install tree -yYou should see output similar to the following.
express-observability/├── node_modules/├── package-lock.json├── package.json├── .env└── src/├── app.js├── server.js├── cache/├── controllers/├── db/├── routes/└── telemetry/ -
Update a
.envfile with the following configuration.PORT=3000OTEL_SERVICE_NAME=express-observability-demoOTEL_EXPORTER_OTLP_ENDPOINT=http://localhost:4317DB_HOST=localhostDB_PORT=5432DB_NAME=observabilityDB_USER=postgresDB_PASSWORD=<YOUR_POSTGRES_PASSWORD>REDIS_HOST=localhostREDIS_PORT=6379cautionReplace
<YOUR_POSTGRES_PASSWORD>with a strong, unique password. Never use default credentials such aspostgresin production. Use the same password when deploying PostgreSQL in Step 4.
The Express.js project structure is now ready. In the next step, you'll instrument the application with OpenTelemetry and configure it to export traces to SigNoz.
Step 3: Instrument the Express.js Application with OpenTelemetry
With the Express.js application running, the next step is to instrument it with OpenTelemetry. OpenTelemetry automatically captures telemetry data such as incoming HTTP requests and exports it to an observability backend for analysis. In this step, you'll configure the OpenTelemetry SDK and export traces to SigNoz using the OpenTelemetry Protocol (OTLP).
-
Install the required OpenTelemetry packages.
npm install \@opentelemetry/api \@opentelemetry/sdk-node \@opentelemetry/auto-instrumentations-node \@opentelemetry/resources \@opentelemetry/semantic-conventions \@opentelemetry/exporter-trace-otlp-grpcThese packages install the OpenTelemetry SDK, enable automatic instrumentation for supported Node.js libraries, and configure the OTLP exporter used to send traces to SigNoz.
-
Create a file named
src/telemetry/instrumentation.jswith the following configuration.const { NodeSDK } = require("@opentelemetry/sdk-node");const { getNodeAutoInstrumentations } = require("@opentelemetry/auto-instrumentations-node");const { OTLPTraceExporter } = require("@opentelemetry/exporter-trace-otlp-grpc");const sdk = new NodeSDK({traceExporter: new OTLPTraceExporter(),instrumentations: [getNodeAutoInstrumentations()],});sdk.start();process.on("SIGTERM", () => {sdk.shutdown().then(() => console.log("OpenTelemetry terminated")).catch((error) => console.error("Error terminating OpenTelemetry", error)).finally(() => process.exit(0));});This configuration initializes the OpenTelemetry SDK, enables automatic instrumentation, and exports traces to the SigNoz OpenTelemetry Collector.
-
Create a file named
src/app.jswith the following configuration.const express = require("express");const helmet = require("helmet");const cors = require("cors");const morgan = require("morgan");const app = express();app.use(helmet());app.use(cors());app.use(express.json());app.use(morgan("dev"));app.get("/", (req, res) => {res.send("Express Observability Demo");});module.exports = app;This file creates the Express application, configures common middleware, defines a sample route, and exports the application so it can be started by the server.
-
Update the
scriptssection in thepackage.jsonfile."scripts": {"test": "echo \"Error: no test specified\" && exit 1","dev": "nodemon src/server.js"} -
Create a file named
src/server.jsto initialize OpenTelemetry before loading the Express application.require("dotenv").config();require("./telemetry/instrumentation");const app = require("./app");const PORT = process.env.PORT || 3000;app.listen(PORT, () => {console.log(`Server running on port ${PORT}`);});Loading the instrumentation before the application starts ensures that OpenTelemetry can automatically instrument supported libraries such as Express.
-
Start the application.
npm run devIf the application starts successfully, you should see output similar to the following.
Server running on port 3000Keep the development server running while completing the remaining steps. Open a new terminal session, navigate to the
express-observabilityproject directory, and run the remaining commands from there. -
Generate application traffic by opening the application in your browser or by sending a request using
curl.curl http://<SERVER-IP>:3000Replace
<SERVER-IP>with your server's IP address. -
Open the SigNoz dashboard.
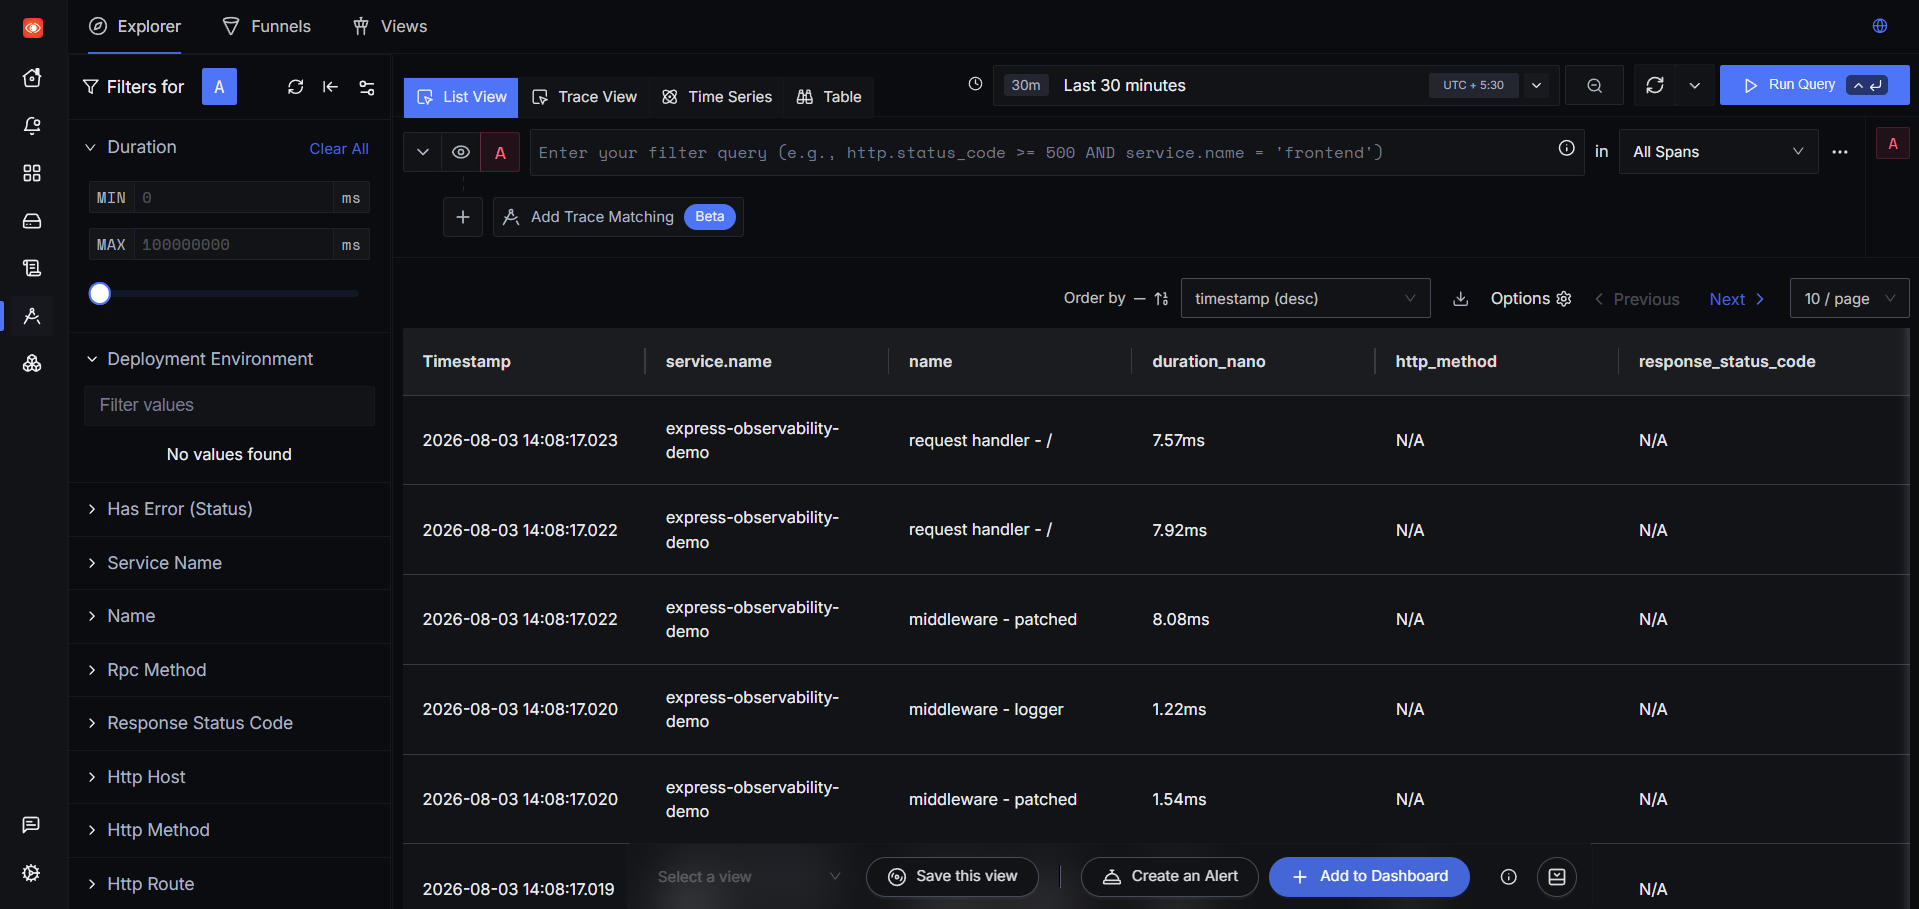
http://<SERVER-IP>:8080From the left navigation menu, open Explorer and verify that traces from the
express-observability-demoservice are being collected.Verify that:
- The service name is express-observability-demo.
- HTTP request traces are displayed.
- Multiple spans are recorded for each request.
- The request completed successfully.
Step 4: Deploy PostgreSQL and Redis
With the Express.js application instrumented, the next step is to deploy PostgreSQL and Redis. PostgreSQL stores the application data, while Redis caches frequently requested responses to improve performance. In this step, you'll deploy both services, configure the application to connect to them, and prepare the infrastructure for the next step.
-
Create a
docker-compose.ymlfile with the following configuration.services:postgres:image: postgres:17container_name: postgresrestart: unless-stoppedenvironment:POSTGRES_USER: postgresPOSTGRES_PASSWORD: <YOUR_POSTGRES_PASSWORD>POSTGRES_DB: observabilityports:- "5432:5432"volumes:- postgres-data:/var/lib/postgresql/datahealthcheck:test: ["CMD-SHELL", "pg_isready -U postgres -d observability"]interval: 10stimeout: 5sretries: 5redis:image: redis:7-alpinecontainer_name: redisrestart: unless-stoppedports:- "6379:6379"healthcheck:test: ["CMD", "redis-cli", "ping"]interval: 10stimeout: 5sretries: 5volumes:postgres-data: -
Start the PostgreSQL and Redis containers.
docker compose up -d -
Verify that both containers are running.
docker psYou should see both the
postgresandrediscontainers in the Up state. -
Connect to the PostgreSQL database.
docker exec -it postgres psql -U postgres -d observability -
Create a sample
userstable.CREATE TABLE users (id SERIAL PRIMARY KEY,name VARCHAR(100),email VARCHAR(255) UNIQUE); -
Insert sample records.
INSERT INTO users (name, email)VALUES('Alice', 'alice@example.com'),('Bob', 'bob@example.com'),('Charlie', 'charlie@example.com'); -
Exit the PostgreSQL shell.
\q -
Create a PostgreSQL connection file named
src/db/postgres.js.const { Pool } = require("pg");const pool = new Pool({host: process.env.DB_HOST,port: process.env.DB_PORT,database: process.env.DB_NAME,user: process.env.DB_USER,password: process.env.DB_PASSWORD,});pool.on("connect", () => {console.log("Connected to PostgreSQL");});pool.on("error", (error) => {console.error("Unexpected PostgreSQL error:", error);process.exit(1);});module.exports = pool;This file creates a PostgreSQL connection pool that the application uses to execute database queries.
-
Create a Redis client file named
src/cache/redis.js.const { createClient } = require("redis");const client = createClient({url: `redis://${process.env.REDIS_HOST}:${process.env.REDIS_PORT}`,});client.on("connect", () => {console.log("Connected to Redis");});client.on("error", (error) => {console.error("Redis Client Error:", error);});(async () => {await client.connect();})();module.exports = client;This file initializes the Redis client and establishes a connection to the Redis server.
After completing this step, both PostgreSQL and Redis are running and connected to the Express.js application.
Step 5: Build a Cached /users API
With PostgreSQL and Redis configured, the next step is to build a /users endpoint. You'll first retrieve data from PostgreSQL and then add Redis caching to improve response times. Finally, you'll verify the generated traces in SigNoz.
-
Create the
src/controllers/userController.jsfile to retrieve users from PostgreSQL.const pool = require("../db/postgres");async function getUsers(req, res) {try {const { rows } = await pool.query("SELECT id, name, email FROM users ORDER BY id;");res.status(200).json(rows);} catch (error) {console.error("Error retrieving users:", error);res.status(500).json({message: "Failed to retrieve users.",});}}module.exports = {getUsers,};This controller retrieves all users from PostgreSQL and returns them as JSON. OpenTelemetry automatically captures the PostgreSQL query without requiring any additional tracing code.
-
Create a file named
src/routes/userRoutes.js.const express = require("express");const { getUsers } = require("../controllers/userController");const router = express.Router();router.get("/users", getUsers);module.exports = router; -
Update the
src/app.jsfile to register the/usersroutes.const express = require("express");const helmet = require("helmet");const cors = require("cors");const morgan = require("morgan");const userRoutes = require("./routes/userRoutes");const app = express();app.use(helmet());app.use(cors());app.use(express.json());app.use(morgan("dev"));app.use(userRoutes);app.get("/", (req, res) => {res.send("Express Observability Demo");});module.exports = app; -
Start the application.
npm run dev -
Generate application traffic by sending a request to the
/usersendpoint.curl http://<SERVER-IP>:3000/usersVerify that the endpoint returns the list of users from PostgreSQL.
-
Update the
src/controllers/userController.jsfile to cache responses in Redis before querying PostgreSQL.const pool = require("../db/postgres");const redis = require("../cache/redis");async function getUsers(req, res) {try {const cachedUsers = await redis.get("users");if (cachedUsers) {return res.json({source: "redis",data: JSON.parse(cachedUsers),});}const { rows } = await pool.query("SELECT id, name, email FROM users ORDER BY id;");await redis.set("users", JSON.stringify(rows));res.json({source: "postgres",data: rows,});} catch (error) {console.error("Error retrieving users:", error);res.status(500).json({message: "Failed to retrieve users.",});}}module.exports = {getUsers,};This controller first checks Redis for cached data. If the data exists, it returns the cached response immediately. Otherwise, it queries PostgreSQL, stores the result in Redis, and returns the response.
-
Send two requests to the
/usersendpoint.curl http://<SERVER-IP>:3000/usersThe first request retrieves data from PostgreSQL and stores it in Redis.
Send the request again.
curl http://<SERVER-IP>:3000/usersThe second request returns the cached response directly from Redis.
-
Open the SigNoz dashboard and navigate to Explorer. Select a trace generated by the
/usersendpoint.Verify that:
- The first request returns data from PostgreSQL.
- The second request returns data from Redis.
- A PostgreSQL query span is generated for the first request.
- Redis GET and SET spans are visible in the trace.
- The second request no longer includes a PostgreSQL query span because the response is served from the cache.
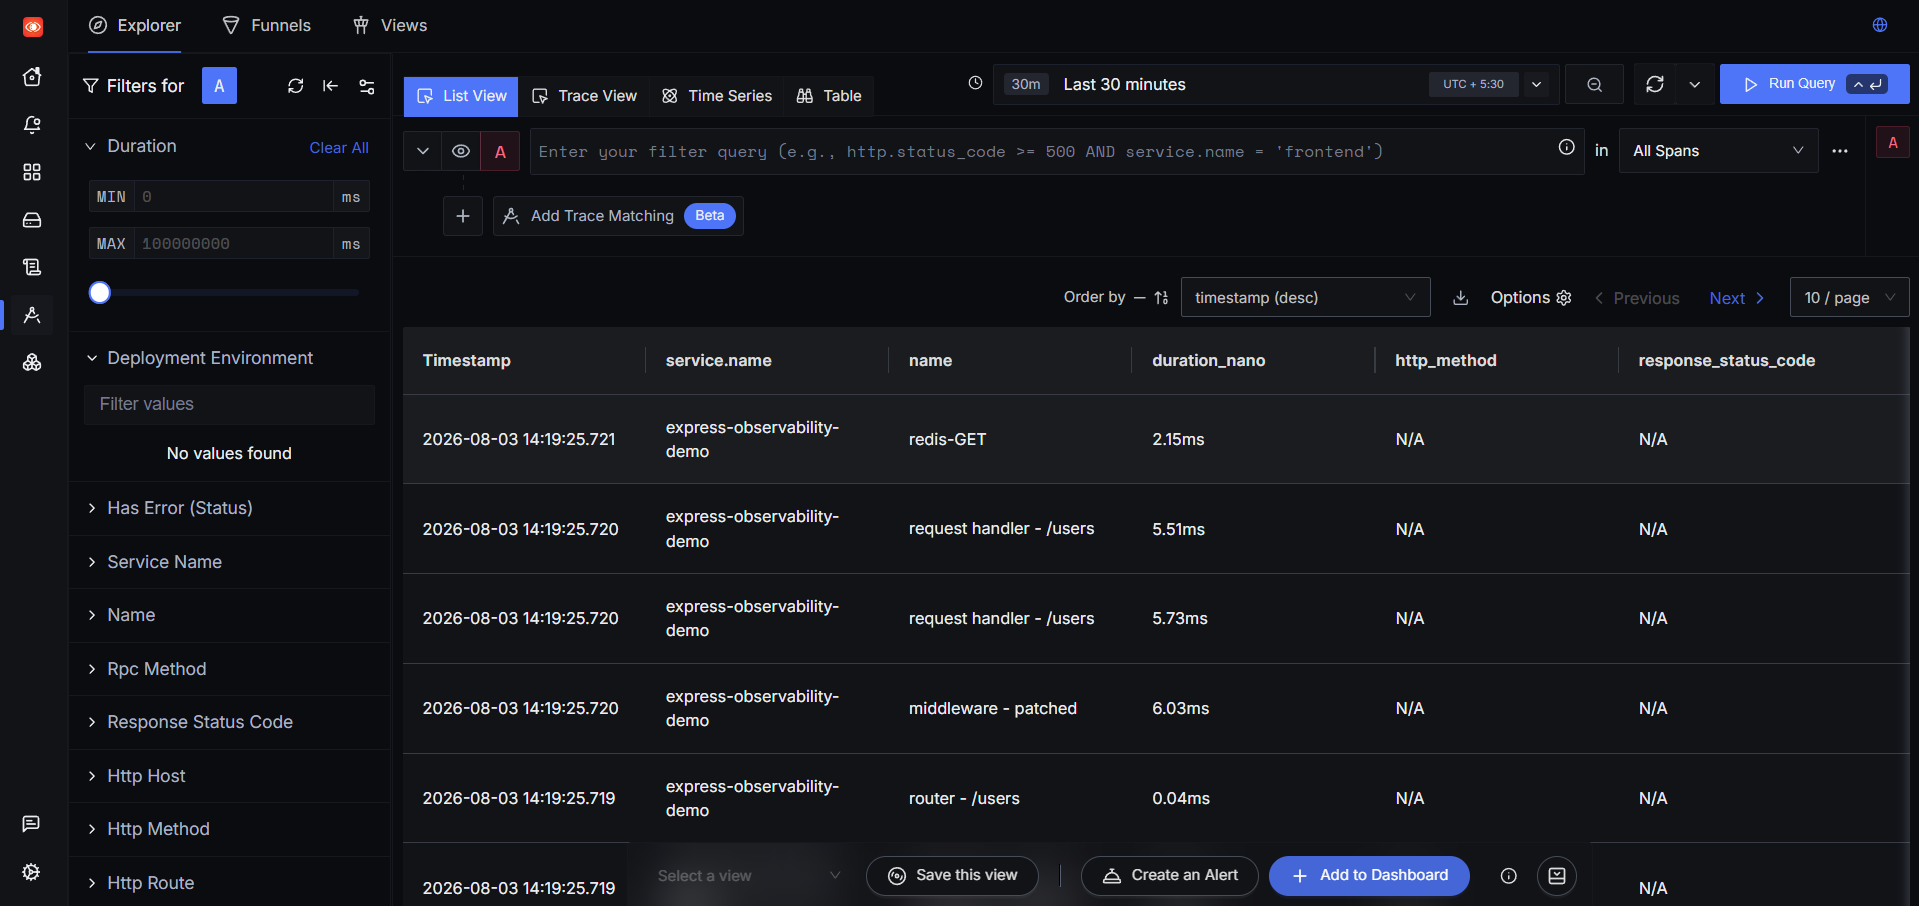
After completing this step, your Express.js application exports HTTP, PostgreSQL, and Redis traces to SigNoz, providing complete visibility into the request lifecycle.
Troubleshooting Common Issues
-
After starting the application, traces were exported successfully, but the service appeared as
unknown_service:nodeinstead of the configured service name.Cause: An older OpenTelemetry exporter package was installed together with a newer OpenTelemetry SDK, causing the service name configuration to be ignored.
Fix: Remove the old exporter package and install the latest OTLP gRPC trace exporter.
npm uninstall @opentelemetry/exporter-otlp-grpcnpm install @opentelemetry/exporter-trace-otlp-grpcAfter restarting the application, the service appeared correctly as
express-observability-demoin SigNoz. -
After instrumenting the application, no traces appeared in the SigNoz dashboard.
Cause: The OpenTelemetry SDK was initialized after the Express application was loaded, preventing automatic instrumentation from patching the required libraries.
Fix: Load the instrumentation file before importing any other application modules.
require('./telemetry/instrumentation');This statement should be the first line in
src/server.js. -
HTTP request traces appeared in SigNoz, but PostgreSQL or Redis spans were not visible.
Cause: The corresponding service was either not running or the application was unable to establish a connection.
Fix: Verify that both containers are running.
docker psAlso verify that the PostgreSQL and Redis connection settings in the
.envfile match your Docker Compose configuration.
Conclusion
You've successfully instrumented an Express.js application with OpenTelemetry and configured it to export traces to SigNoz. Along the way, you integrated PostgreSQL for data storage and Redis for caching, allowing you to observe HTTP requests, database queries, and cache operations from a single dashboard.
With this observability pipeline in place, you can better understand how requests flow through your application, identify performance bottlenecks, and troubleshoot issues more efficiently. To continue exploring application observability, check out the following resources: