Build an OpenTelemetry Collector Pipeline with Docker Compose and SigNoz
Modern applications generate traces, metrics, and logs that help monitor performance and troubleshoot issues. While OpenTelemetry provides a standard way to instrument applications and collect telemetry data, the data still needs a safe way to reach an observability platform. The OpenTelemetry Collector acts as a central telemetry pipeline that receives, processes, and exports telemetry to backends such as SigNoz, making observability more flexible and easier to manage.
In this article, you'll build an OpenTelemetry Collector pipeline using Docker Compose and connect it to SigNoz. You'll explore the core components of the Collector, including receivers, processors, exporters, and pipelines, then configure it to receive telemetry from a sample application and forward it to SigNoz. By the end of this article, you'll have a working telemetry pipeline and a clear understanding of how data flows from an instrumented application to SigNoz.
This article was tested on a live server before publication. Every command, configuration file, and verification step was validated on the final deployment to maintain accuracy.
Prerequisites
Before you begin, make sure you have the following:
- An Ubuntu 24.04 server with at least 4 vCPUs and 8 GB RAM.
- Docker Engine and the Docker Compose plugin installed.
- Node.js 20 or later installed.
- Basic understanding of OpenTelemetry concepts such as traces, metrics, and logs.
Architecture Overview
The OpenTelemetry Collector acts as the central telemetry pipeline between instrumented applications and SigNoz. The sample application generates traces using the OpenTelemetry SDK and exports them to the Collector over OTLP. The Collector receives the telemetry, processes it through a configurable pipeline, and exports it to SigNoz, where you can visualize and analyze traces from a single dashboard.
              HTTP Request
                    │
                    ▼
           ┌─────────────────┐
           │     Sample      │
           │   Application   │
           └────────┬────────┘
                    │
            OpenTelemetry SDK
                    │
             OTLP (gRPC:4317)
                    │
                    ▼
     ┌────────────────────────────┐
     │  OpenTelemetry Collector   │
     ├────────────────────────────┤
     │          Receiver          │
     │              │             │
     │              ▼             │
     │         Processor          │
     │              │             │
     │              ▼             │
     │          Exporter          │
     └──────────────┬─────────────┘
                    │
                    ▼
             ┌─────────────┐
             │   SigNoz    │
             │  Dashboard  │
             └─────────────┘
Step 1: Install SigNoz
Before instrumenting the Express.js application, you need an observability backend to collect, store, and visualize telemetry data. In this step, you'll deploy SigNoz using the foundryctl CLI and verify that it's ready to receive traces from your application.
-
Install the Foundry CLI and add it to your current shell's
PATH.curl -fsSL https://signoz.io/foundry.sh | bashexport PATH="/root/.local/bin:$PATH" -
Verify that the installation completed successfully.
foundryctl version -
Create a file named
casting.yamlwith the following configuration.apiVersion: v1alpha1kind: Installationmetadata:name: signozspec:deployment:flavor: composemode: dockerThis configuration instructs
foundryctlto deploy SigNoz using Docker Compose. -
Deploy SigNoz using the installation configuration.
foundryctl cast -f casting.yamlThe installer validates your Docker environment, generates the required Docker Compose resources, and starts the SigNoz services.
-
Verify that the deployment completed successfully.
docker psYou should see containers such as
signoz-frontend,signoz-query-service,signoz-otel-collector, andclickhouse. -
Open the SigNoz dashboard in your browser.
http://<SERVER-IP>:8080Replace
<SERVER-IP>with your server's IP address. If the installation completed successfully, the SigNoz setup page should load. Create the initial administrator account to access the dashboard.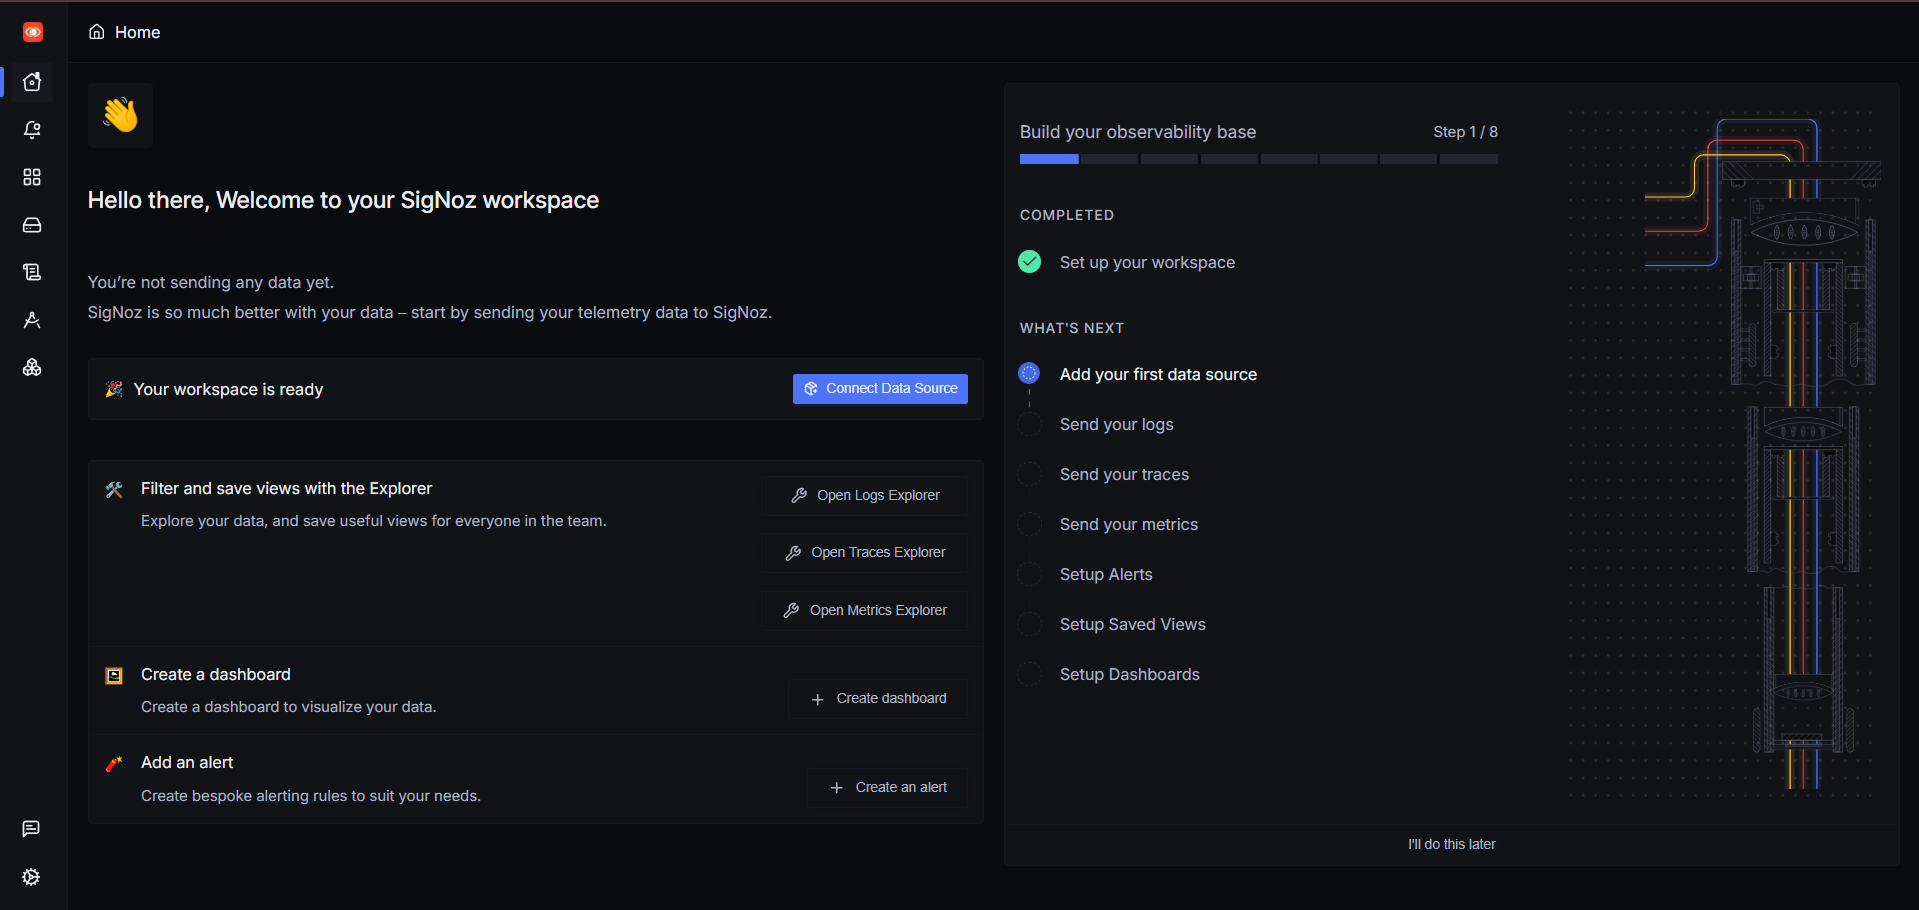
Step 2: Create the Sample Application
With SigNoz running, the next step is to create a simple Express.js application that you'll use throughout this tutorial. The application serves as a telemetry source for the OpenTelemetry Collector. In this step, you'll initialize a new Node.js project, install the required dependencies, and create the basic project structure. You'll instrument the application with OpenTelemetry in the next step.
-
Create a project directory and navigate into it.
mkdir otel-collector-pipelinecd otel-collector-pipeline -
Initialize a new Node.js project.
npm init -y -
Install the application dependency.
npm install express -
Install the development dependency.
npm install --save-dev nodemon -
Create the project structure.
mkdir srctouch .envtouch src/app.jstouch src/server.js -
Verify that the project structure was created successfully.
tree -L 2 -I node_modulesIf the
treecommand is not installed, install it using:sudo apt updatesudo apt install tree -yYou should see output similar to the following.
otel-collector-pipeline/├── package.json├── package-lock.json├── .env└── src/├── app.js└── server.js
The sample application is now ready. In the next step, you'll instrument the application with OpenTelemetry and configure it to export telemetry to the OpenTelemetry Collector.
Step 3: Set Up the OpenTelemetry Sample Application
With the project structure in place, the next step is to prepare the sample application for OpenTelemetry instrumentation. In this step, you'll install the required OpenTelemetry packages, create the instrumentation directory, and build a simple Express.js application that will generate telemetry data for the OpenTelemetry Collector.
-
Install the required OpenTelemetry packages.
npm install \@opentelemetry/api \@opentelemetry/sdk-node \@opentelemetry/auto-instrumentations-node \@opentelemetry/resources \@opentelemetry/semantic-conventions \@opentelemetry/exporter-trace-otlp-grpc \@opentelemetry/exporter-metrics-otlp-grpc -
Create a directory for the OpenTelemetry instrumentation.
mkdir src/telemetrytouch src/telemetry/instrumentation.js -
Create a simple Express application in
src/app.js.const express = require("express");const app = express();app.get("/", (req, res) => {res.json({message: "Hello from OpenTelemetry Collector Pipeline!",});});module.exports = app; -
Create the application entry point in
src/server.js.const app = require("./app");const PORT = process.env.PORT || 3000;app.listen(PORT, () => {console.log(`Server is running on port ${PORT}`);}); -
Update the
scriptssection of yourpackage.json."scripts": {"start": "node src/server.js","dev": "nodemon src/server.js"} -
Start the application.
npm run dev -
Open a new terminal, navigate into the project repo, and verify that the application is running.
curl http://localhost:3000You should receive the following response.
{"message": "Hello from OpenTelemetry Collector Pipeline!"}
At this point, the sample application is running successfully and is ready to be instrumented with OpenTelemetry. In the next step, you'll configure the OpenTelemetry SDK and export telemetry to the OpenTelemetry Collector.
Step 4: Instrument the Application with OpenTelemetry
With the sample application running, the next step is to instrument it with OpenTelemetry. You'll configure the OpenTelemetry SDK, enable automatic instrumentation, and export traces to the OpenTelemetry Collector. The SDK must be initialized before the Express application starts so that it can automatically instrument supported libraries.
-
Create the OpenTelemetry instrumentation file at
src/telemetry/instrumentation.js.const { NodeSDK } = require("@opentelemetry/sdk-node");const { OTLPTraceExporter } = require("@opentelemetry/exporter-trace-otlp-grpc");const {getNodeAutoInstrumentations,} = require("@opentelemetry/auto-instrumentations-node");const { resourceFromAttributes } = require("@opentelemetry/resources");const {ATTR_SERVICE_NAME,ATTR_SERVICE_VERSION,ATTR_DEPLOYMENT_ENVIRONMENT,} = require("@opentelemetry/semantic-conventions");const traceExporter = new OTLPTraceExporter({url: "http://localhost:4317",});const resource = resourceFromAttributes({[ATTR_SERVICE_NAME]: "otel-collector-pipeline",[ATTR_SERVICE_VERSION]: "1.0.0",[ATTR_DEPLOYMENT_ENVIRONMENT]: "development",});const sdk = new NodeSDK({resource,traceExporter,instrumentations: [getNodeAutoInstrumentations(),],});sdk.start();process.on("SIGTERM", async () => {await sdk.shutdown();console.log("OpenTelemetry SDK shut down successfully.");}); -
Update
src/server.jsto initialize the OpenTelemetry SDK before loading the Express application.require("./telemetry/instrumentation");const app = require("./app");const PORT = process.env.PORT || 3000;app.listen(PORT, () => {console.log(`Server is running on port ${PORT}`);}); -
Start the application.
npm run dev -
Open a new terminal and generate a few requests to the application.
curl http://localhost:3000curl http://localhost:3000curl http://localhost:3000Each request should return the following response.
{"message": "Hello from OpenTelemetry Collector Pipeline!"} -
Open the SigNoz dashboard by visiting
http://<SERVER-IP>:8080. From the left navigation menu, select Explorer and verify that traces from theotel-collector-pipelineservice are displayed.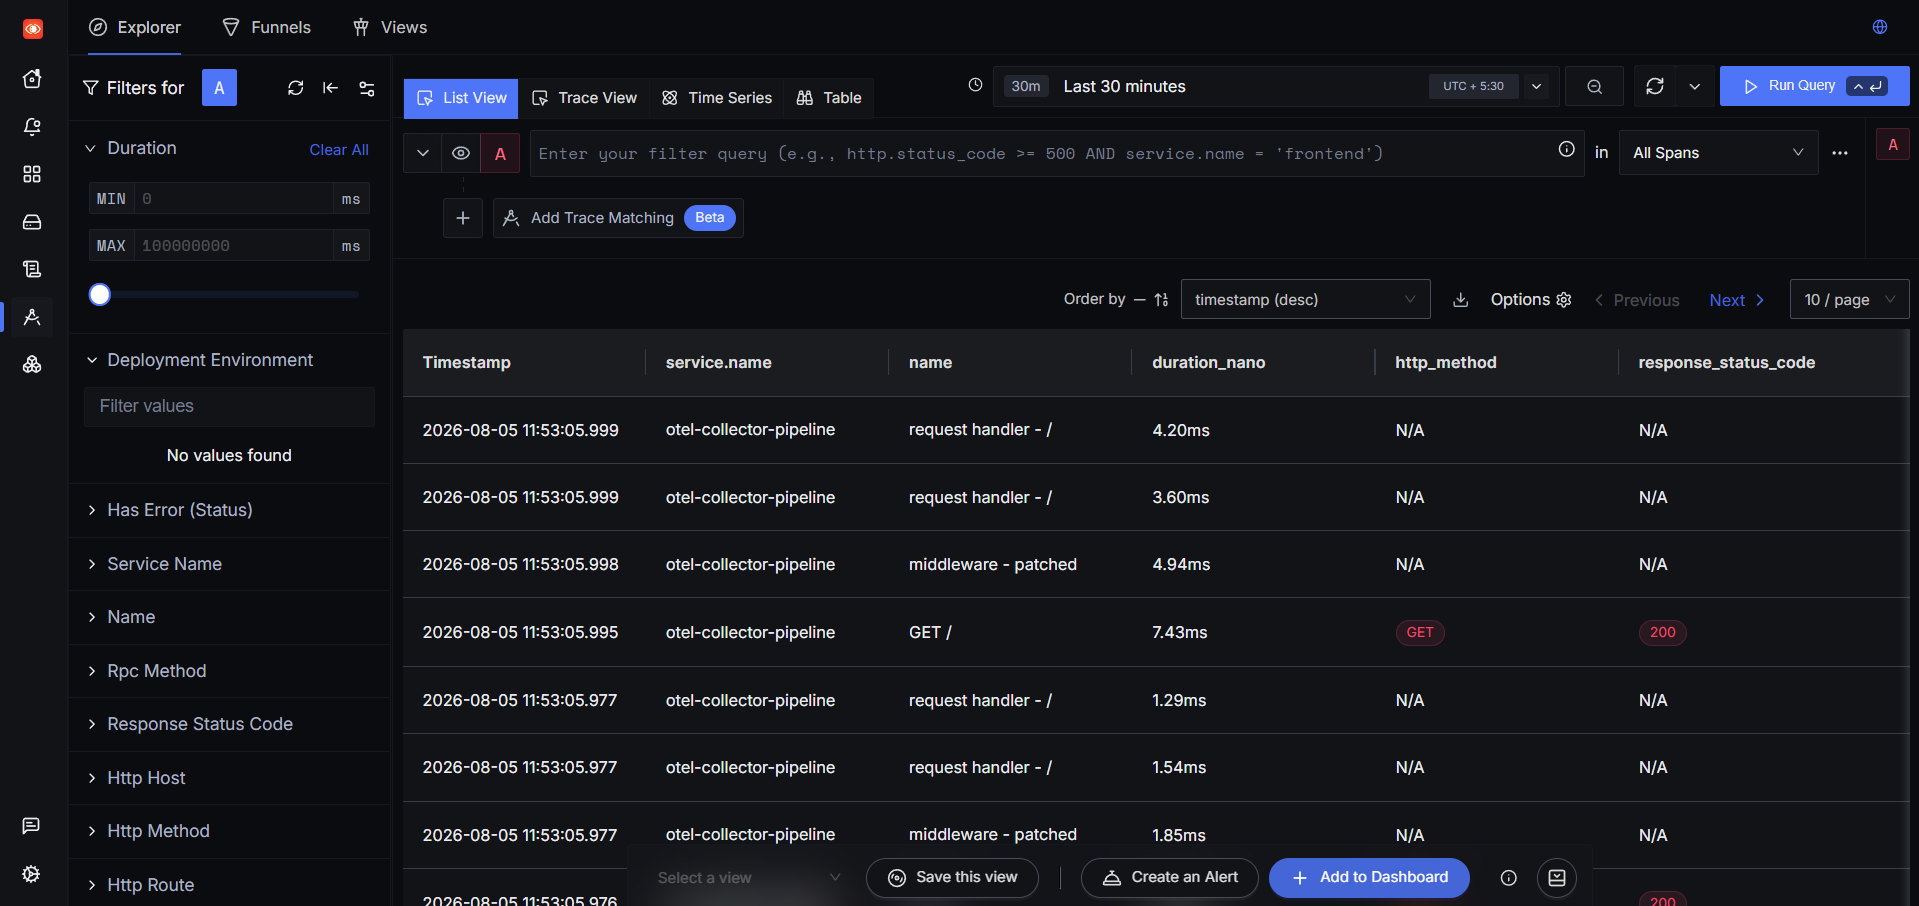
At this point, you've successfully built a working OpenTelemetry Collector pipeline. Before concluding, it's helpful to understand how the Collector processes telemetry and forwards it to SigNoz.
Step 5: Understand the OpenTelemetry Collector Pipeline
In this article, you used the OpenTelemetry Collector as an intermediary between your application and SigNoz. Instead of sending telemetry directly to the observability platform, the application exports telemetry to the Collector, which receives, processes, and forwards it to the appropriate backend. This architecture provides a centralized and vendor-neutral way to collect telemetry from multiple applications.
The following diagram illustrates the telemetry flow built in this tutorial.
                                    Express Application
                                            │
                                            ▼
                                    OpenTelemetry SDK
                                            │
                                            ▼
                                    OTLP Trace Exporter
                                            │
                                            ▼
                                    OpenTelemetry Collector
                                            │
                                    ┌─────────────┐
                                    │ Receiver    │
                                    │ Processor   │
                                    │ Exporter    │
                                    └─────────────┘
                                            │
                                            ▼
                                       ClickHouse
                                            │
                                            ▼
                                    SigNoz Dashboard
The OpenTelemetry Collector configuration is organized into four main components: receivers, processors, exporters, and pipelines.
Receivers
Receivers collect telemetry from applications and external systems. In this deployment, the Collector uses the OTLP receiver to accept telemetry over both gRPC and HTTP.
receivers:
  otlp:
    protocols:
      grpc:
        endpoint: 0.0.0.0:4317
      http:
        endpoint: 0.0.0.0:4318
The Express application configured in this tutorial exports traces to the OTLP gRPC endpoint on port 4317, where the Collector receives the telemetry.
Processors
Processors transform or optimize telemetry before it is exported. The batch processor groups telemetry into batches, reducing network overhead and improving export performance.
processors:
  batch:
Batching is a recommended practice for production deployments because it improves throughput and reduces the number of requests sent to the backend.
Exporters
Exporters send processed telemetry to a storage backend or observability platform. In the SigNoz deployment, trace data is exported to ClickHouse.
exporters:
  clickhousetraces:
SigNoz stores trace data in ClickHouse and retrieves it to power the Explorer, Services, and Traces views.
Pipelines
A pipeline connects receivers, processors, and exporters into a complete telemetry workflow. The trace pipeline used by SigNoz follows this flow:
service:
  pipelines:
    traces:
      receivers:
        - otlp
      processors:
        - batch
      exporters:
        - clickhousetraces
When the Express application generates a trace, the Collector first receives it through the OTLP receiver, batches the telemetry using the batch processor, and then exports the processed trace to ClickHouse. SigNoz reads the stored telemetry from ClickHouse and displays it in the dashboard, allowing you to analyze requests, latency, and application performance.
Understanding these core Collector components makes it easier to extend your observability pipeline as your applications grow. The same architecture can be used to collect telemetry from multiple services and route it to one or more observability backends without modifying your application code.
Conclusion
In this tutorial, you built an OpenTelemetry Collector pipeline using Docker Compose and integrated it with SigNoz to collect and visualize application traces. You deployed SigNoz, instrumented a sample Express.js application with the OpenTelemetry SDK, exported telemetry to the OpenTelemetry Collector, and verified the collected traces in the SigNoz dashboard.
You also learned how the OpenTelemetry Collector processes telemetry through receivers, processors, exporters, and pipelines before forwarding it to an observability backend. This architecture provides a flexible and vendor-neutral foundation that can be extended to collect telemetry from multiple applications as your observability needs grow.